Building a 3-Statement Model: A Step-by-Step Walkthrough

The 3-statement model is the backbone of financial analysis, linking the income statement, balance sheet, and cash flow statement into a dynamic, forward-looking tool.
In this guide, we’ll walk through the process of building a 3-statement model.
Step 1: Input Historical Data
Objective: Establish a baseline using historical financials.
- Populate the template with historical data for all three statements.
- Key historical inputs:
- Income Statement: Revenue, COGS, operating expenses, depreciation, interest expense, and net income.
- Balance Sheet: Cash, accounts receivable, inventory, PP&E, accounts payable, debt, and equity.
- Cash Flow Statement: Historical operating, investing, and financing cash flows.
Why This Matters: Historical trends (e.g., revenue growth, margin stability) inform future assumptions.
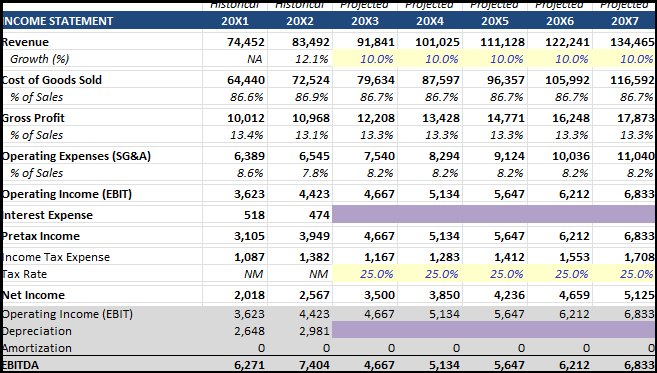
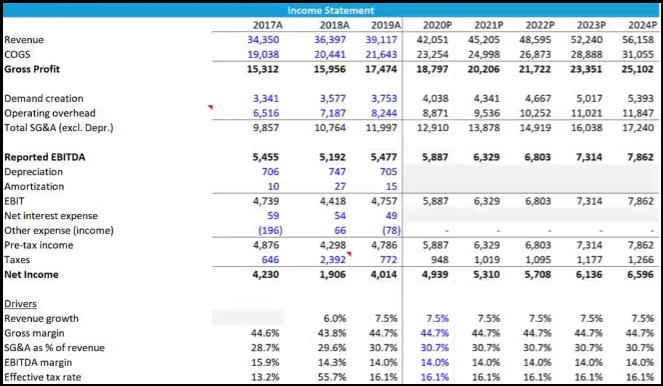
Step 2: Project the Income Statement
Objective: Forecast profitability and link key drivers.
- Revenue: Project using historical growth rates or management guidance.
- COGS & Operating Expenses: Tie to revenue percentages (e.g., % of sales using the average of the last 2 years).
- Purple-Shaded Items:
- Interest Expense: Calculated later in the Debt Schedule (leave blank for now).
- Depreciation: Derived from the PP&E Schedule (link after building supporting schedules).
Key Tip: Use consistent tax rates (e.g., 25%) for pretax income.
Step 3: Build the Balance Sheet
Objective: Assets = Liabilities + Equity
- Current Assets:
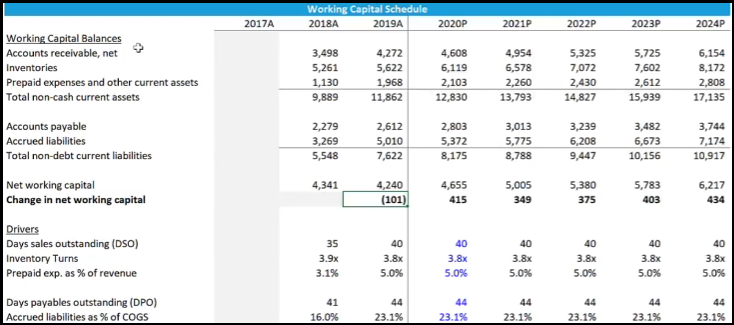
- Accounts Receivable: Use Debtor Days = (AR / Revenue) × 365 – use the Avg of the last 2 years or create a working capital schedule.
- Inventory: Use Inventory Days = (Inventory / COGS) × 365 – use the Avg of the last 2 years or create a working capital schedule.
- Cash: Purple-shaded - calculated later in the cash flow statement.
- Fixed Assets:
- PP&E, Net: Purple-shaded - linked to the PP&E Schedule.
- Liabilities & Equity:
- Line of Credit and Long-Term Debt: Purple-shaded - calculated in the Debt Schedule.
- Accounts Payables: Use Creditor Days = (AP / COGS) × 365 – use the Avg of the last 2 years or create a working capital schedule.
- Retained Earnings: Prior retained earnings + current net income (from income statement).
Step 4: Project the Cash Flow Statement
Objective: Reconcile cash movements and link to balance sheet cash.
- Operating Activities:
- Start with Net Income (from income statement).
- Add Back Non-Cash Items:
- Depreciation: Purple-shaded (link to PP&E Schedule).
- Adjust for Working Capital:
- Calculate changes in AR, inventory, and AP from balance sheet.
- Asset = Opening Balance - Closing Balance.
- Liability = Closing Balance - Opening Balance.
- Calculate changes in AR, inventory, and AP from balance sheet.
- Investing Activities:
- Capital Expenditures (CapEx): Purple-shaded (link to PP&E Schedule).
- Financing Activities:
- Line of Credit and Long-Term Debt: Purple-shaded (link to Debt Schedule).
- Ending Cash Balance: Ending Cash = Beginning Cash + Net Cash Flow (Operating + Investing + Financing). Link to the cash balance on the balance sheet.
Step 5: Build Supporting Schedules
Objective: Calculate purple-shaded items to finalize the model.
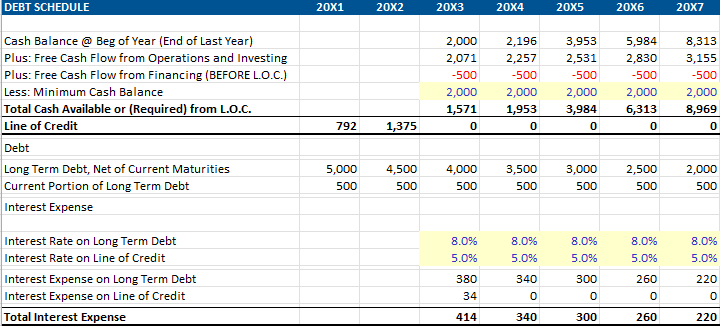
Debt Schedule
- Line of Credit (Revolver): Acts as a plug to cover cash shortfalls. LOC = MAX(0, Opening LOC - Cash Available)
- Interest Expense: Interest = (Avg Debt Balance × Interest Rate) + (Avg Line of Credit Balance × LOC Rate)
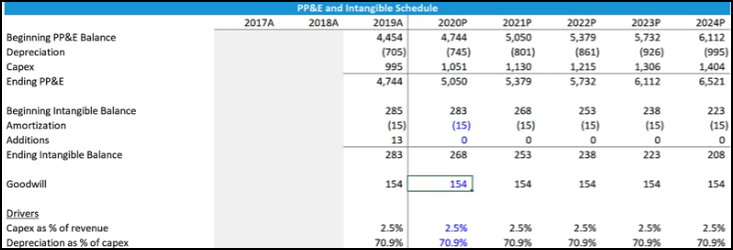
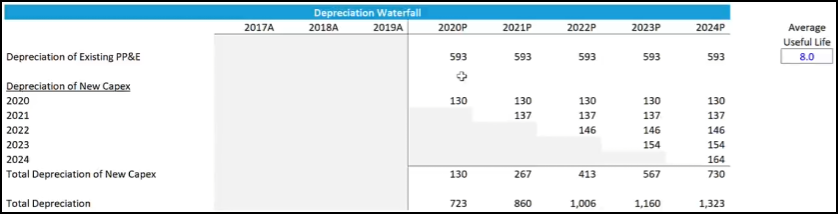
PP&E Schedule
- CapEx: Forecast based on growth or maintenance needs (e.g., % of revenue).
- Depreciation: Use straight-line or % of revenue method (avg of last 2 years).
- PP&E Roll-Forward: Ending PP&E = Beginning PP&E + CapEx - Depreciation.
How It All Connects:
- The Debt Schedule feeds interest expense to the income statement and debt balances to the balance sheet (Enable iterative calculation).
- The PP&E Schedule feeds depreciation to the income statement and PP&E to the balance sheet.
Working Capital Schedule - Example
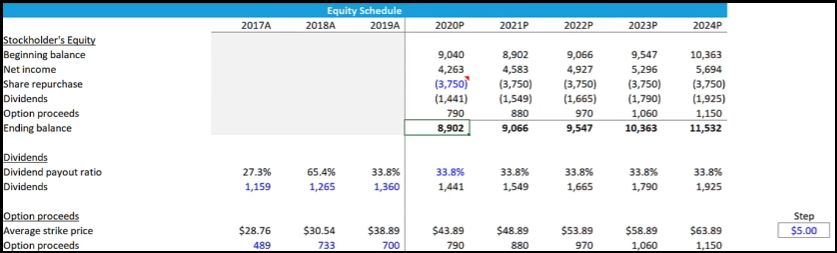
Equity Schedule - Example
Depreciation Waterfall - Example
Step 6: Final Balancing & Formatting
- Check the Balance Sheet: Ensure Assets = Liabilities + Equity for all years.
- Formatting: Remove grid lines, and cell backgrounds for constants.
Why This Structure Works
- Top-Down Logic: Revenue drives the income statement, which feeds into retained earnings and cash flow.
- Dynamic Links: Changes in assumptions (e.g., slower growth) cascade through all statements.
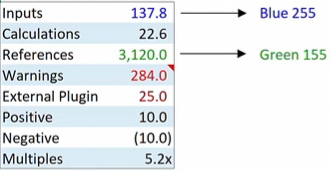
Excel Cell Highlighting Guide
- 🟨 Yellow Background + 🔵 Blue Text (0,0,255)
- Purpose: Indicates constant values or manual inputs (values entered directly by user).
- Examples:
- Fixed assumptions (e.g., tax rate = 25%).
- Hardcoded constants that don’t pull from other sheets or formulas.
- 🟪 Purple Background
- Purpose: Highlights cells which will be calculated from supporting schedules.
- Examples:
- Depreciation pulled from PP&E schedule.
- Interest calculated in Debt schedule
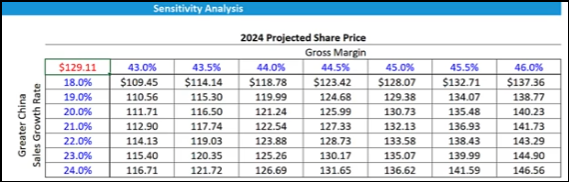
Advanced: Sensitivity Analysis
This is achieved using Data - What-if Analysis in Excel.
The example below is displaying the impact of gross margin changes and a revenue category growth rate changing on the projected share price.
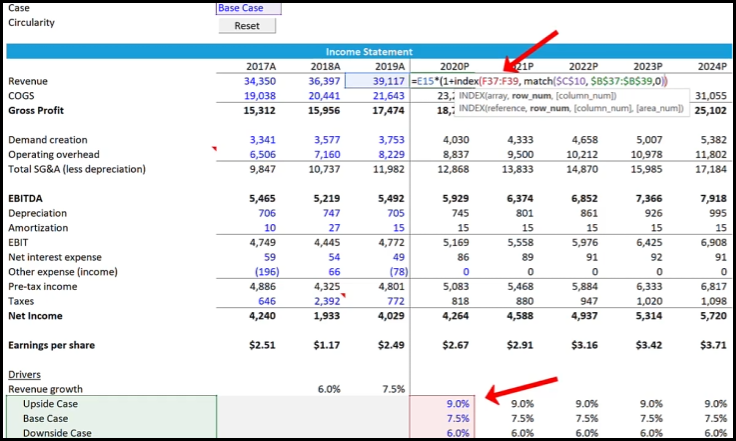
Advanced: Scenario Analysis
- Create a base list for users: Data - Data Validation - Allow List (Upside case, Base case, or Downside case).
- Modify the revenue growth rate to Index Match (see formula below) for switching the revenue growth rate based on the case selected; Upside case, Base case, or Downside case.
Conclusion
Building a 3-statement model is a systematic process of linking assumptions, schedules, and checks.
By following this step-by-step approach—and leaning on supporting schedules for complex calculations—you’ll create a robust model that answers critical questions about liquidity, profitability, and growth.
Next: Learn about The Discounted Cash Flow Model: https://www.myfinanceprocess.com/the-discounted-cash-flow-model/