The Finance Effectiveness Matrix: How Finance Teams Create Impact

Modern finance teams face a defining question:
- Are we recording value or creating it?
The traditional finance model was built for stability: periodic closes, annual budgets, compliance cycles, and post-mortem analysis. But today’s environment — defined by technological disruption, AI automation, capital volatility, and compressed decision cycles — demands something else.
It demands a shift from Reactive Information to Proactive Impact.
The Finance Effectiveness Matrix provides a practical framework for diagnosing where your finance function operates today — and how to systematically evolve it into a strategic force multiplier.
The Architecture of the Finance Effectiveness Matrix
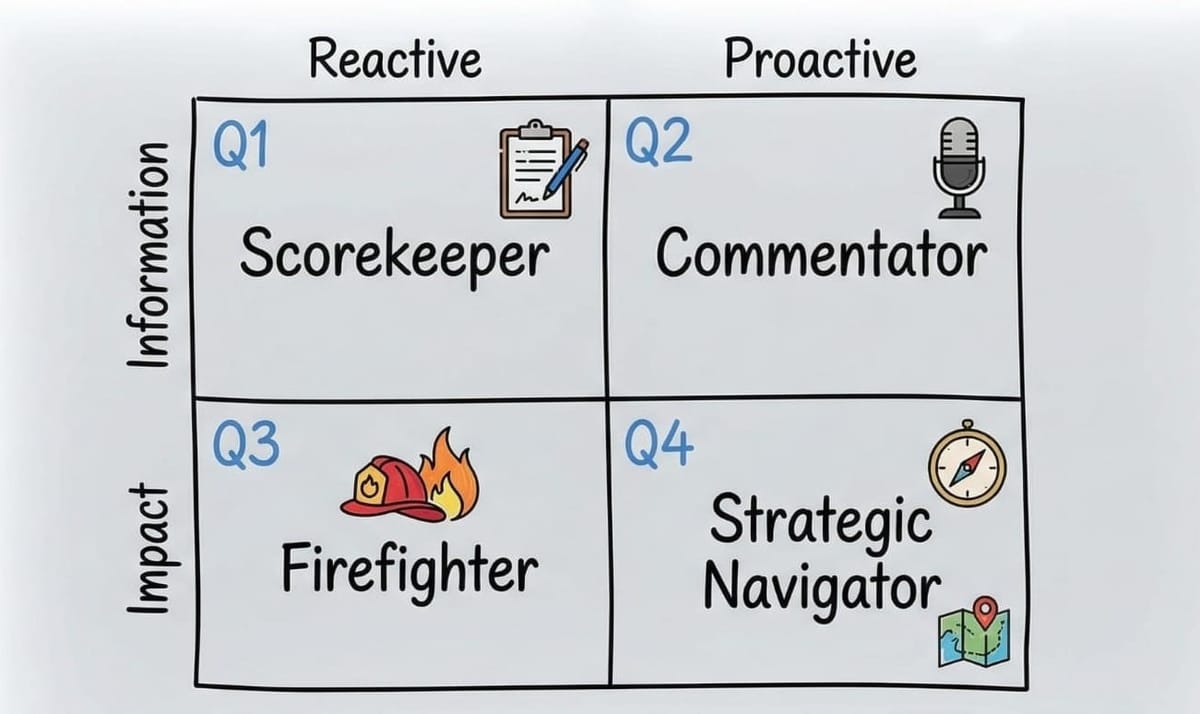
The model is defined by two axes:
Axis 1: Time Orientation
Reactive (Past-Focused) ↔ Proactive (Future-Focused)
This axis measures latency between business events and finance engagement.
- Reactive finance measures what already happened.
- Proactive finance influences what will happen.
The shorter the latency — and the earlier finance intervenes — the greater the strategic leverage.
Axis 2: Value Delivery
Information (Outputs) ↔ Impact (Outcomes)
This axis measures whether finance delivers:
- Reports and data
or - Decisions, recommendations, and measurable business outcomes.
Information is necessary.
Impact is differentiating.
The Four Quadrants of Finance Maturity
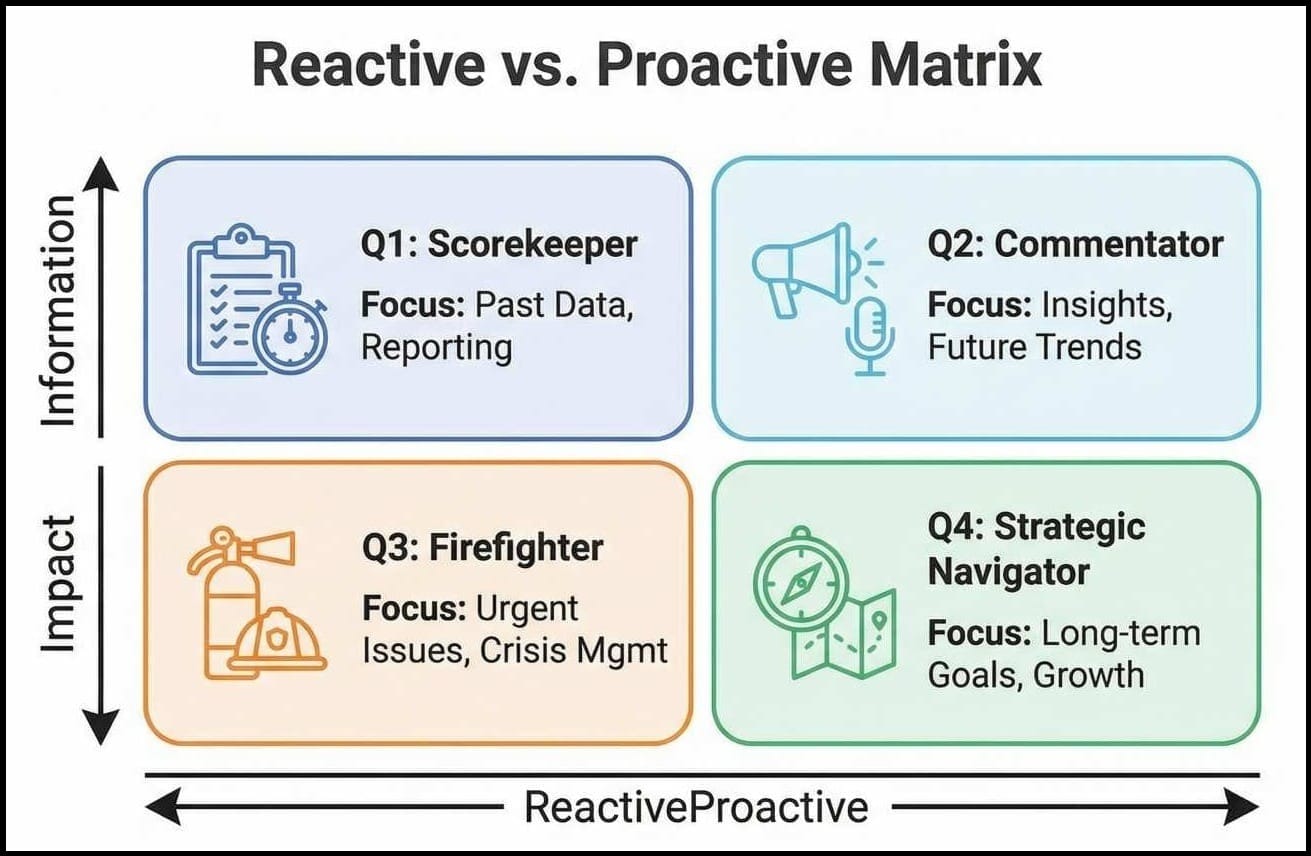
Each quadrant represents a distinct operating model — not just in output, but in mindset, incentives, technology stack, and organizational psychology.
Quadrant 1: The Scorekeeper
Reactive + Information
This is the traditional finance archetype — historically respected, but strategically limited.
Core Identity
- Guardian of accuracy
- Owner of compliance
- Custodian of controls
Operating Model Characteristics
1. Transactional Dominance
- 60–80% of team time spent on:
- reconciliations
- manual journal entries
- data validation
- variance compilation
2. Calendar-Driven Workflow
The monthly close dictates life.
During close:
- finance disappears from strategic dialogue
- operational leaders wait for numbers
- decisions stall
3. Siloed Structure
- Finance interacts with business units mainly through cost policing.
- Relationship tone: enforcement, not partnership.
Strategic Risks of Staying Here
1. Commoditization
Transaction processing is the easiest function to automate or outsource.
If your value proposition is:
- We produce accurate reports.
Technology will eventually do it cheaper and faster.
2. Executive Marginalization
Scorekeepers rarely influence:
- capital allocation
- pricing strategy
- product investment
- growth decisions
They are invited to explain results — not shape them.
3. Strategic Blindness
When finance looks only at trailing indicators:
- leadership operates on stale assumptions
- performance surprises increase
- risk compounds silently
The organization drives while looking in the rearview mirror.
Typical KPIs in Q1
- Days to close
- Audit adjustments
- Transaction error rates
- Finance cost ratio
All efficiency metrics.
None strategic.
Quadrant 2: The Commentator
Proactive + Information
This is where many modern FP&A teams operate.
They forecast.
They model.
They analyze.
But they don’t always influence.
Core Identity
- Analysts
- Forecasters
- Insight producers
What Improves from Q1
- Rolling forecasts begin
- BI dashboards proliferate
- Scenario modeling increases
Finance becomes predictive — but not prescriptive.
The Insight Without Action Problem
1. Report Production ≠ Value Creation
The Commentator often confuses analytical sophistication with strategic influence.
50-slide decks.
Beautiful dashboards.
Granular forecasts.
But:
- Did behavior change?
- Did capital move?
- Did risk reduce?
If not, the value stops at information.
2. The News Anchor Effect
The Commentator says:
“Revenue will miss by 8%.”
The Navigator says:
“Shift $1.2M from Channel A to Channel B within 30 days to offset 6% of the shortfall.”
The difference is ownership.
3. Organizational Friction
Finance frustration often peaks here:
- “We warned them.”
- “They didn’t listen.”
- “We predicted this.”
Prediction without influence breeds cynicism.
Structural Gap
Most Q2 teams lack:
- embedded business partnering
- operational authority
- decision accountability
- executive sponsorship
The barrier isn’t data.
It’s proximity and trust.
Quadrant 3: The Firefighter
Reactive + Impact
This quadrant is high visibility — and high risk.
Finance becomes valuable during crisis.
Core Identity
- Crisis solver
- Cash protector
- Emergency negotiator
Typical Contexts
- High-growth startups
- Turnarounds
- Cash-constrained environments
- Post-acquisition chaos
The Hero Trap
Organizations often reward Firefighters because they:
- Save payroll at the last minute
- Restructure debt under pressure
- Slash costs quickly
But ask a deeper question:
Why was the crisis allowed to emerge?
Hidden Consequences
1. Burnout
Constant urgency leads to:
- high turnover
- emotional fatigue
- control breakdowns
2. Process Decay
When survival dominates:
- documentation slips
- preventative controls weaken
- strategy gets postponed
3. Short-Termism
Emergency cost cuts may:
- damage growth engine
- undermine morale
- sacrifice long-term value
Firefighting feels impactful — but often destroys strategic runway.
Quadrant 4: The Strategic Navigator
Proactive + Impact
This is the mature finance function.
Not reactive.
Not purely analytical.
Not heroic.
Strategic.
Core Identity
- Co-pilot to the CEO
- Capital allocator
- Value architect
Defining Capabilities
1. Driver-Based Management
Navigators model operational levers:
- pipeline coverage
- churn rate
- sales productivity
- hiring ramp
- customer acquisition cost
They understand that financial outcomes are downstream of operational inputs.
2. Scenario Governance
They manage through:
- Base case
- Upside case
- Downside case
- Strategic option cases
When triggers are hit, pre-agreed actions execute.
Uncertainty becomes manageable.
3. Embedded Partnership
Finance partners sit:
- in marketing planning sessions
- in product roadmap meetings
- in sales forecast reviews
They influence before commitments are locked.
4. Prescriptive Analytics
Navigator output looks like:
- “Delay hiring in Region B by 45 days.”
- “Increase enterprise pricing by 3% under elasticity assumption X.”
- “Accelerate product launch to capture window Y.”
Clear. Specific. Actionable.
Behavioral Shift Required
The jump to Q4 is not primarily technical.
It’s relational.
Finance must develop:
- storytelling capability
- conflict comfort
- intellectual courage
- cross-functional empathy
Influence requires trust.
The Role of Technology
Technology is not the strategy — but it enables the strategy.
To reach Quadrant 4, finance needs infrastructure that:
1. Automates Information
- real-time actuals ingestion
- close automation
- variance auto-commentary
Free time → higher cognition work.
2. Connects Drivers to Financial Outcomes
- CRM → revenue models
- HRIS → compensation modeling
- Operations → working capital impact
Without driver integration, finance remains descriptive.
3. Enables Real-Time Scenario Modeling
Strategic meetings require:
- instant modeling
- version control
- scenario comparisons
Spreadsheets break here. Platforms don’t.
4. Integrates AI for Insight Generation
AI can:
- auto-explain variances
- detect anomalies
- highlight risk clusters
Humans then focus on decisions.
A Practical Transformation Roadmap
Phase 1: Stabilize and Automate (Escape Q1)
- single source of truth
- close automation
- data governance
- KPI standardization
Outcome: time freed for analysis.
Phase 2: Predict (Build Q2)
- rolling forecasts
- leading indicator dashboards
- liquidity modeling
- risk pre-mortems
Outcome: earlier awareness.
Phase 3: Influence (Reach Q4)
- embed finance partners
- redefine meeting cadence
- deliver one-page action memos
- measure finance by decision impact
Outcome: strategic authority.
Measuring Finance Maturity
If you want to know whether you’ve truly evolved:
Q4 Indicators
- Forecast accuracy within ±5%
- Leading indicators embedded in >50% of reporting
- Finance involved in 100% of major initiatives
- Internal NPS >50 from business leaders
60% of finance time spent on analysis & strategy
If Finance cannot point to specific strategic decisions it shaped, you are not yet in Quadrant 4.
The Strategic Mandate
In hyper-competitive markets:
Reactive finance is a liability.
Predictive-only finance is insufficient.
Crisis finance is unstable.
Only proactive, impact-driven finance scales.
The future CFO is not the chief accounting officer.
They are the chief value architect.