Sensitivity Analysis: How Input Variables Impact Outputs

Financial models are essential tools for forecasting, planning, and decision-making.
But let’s face it: the future is uncertain.
Every financial model relies on assumptions, and these assumptions are rarely set in stone. What if sales grow slower than expected? What if interest rates rise? What if costs spike?
Sensitivity analysis is the tool that helps you answer these what-ifs by stress-testing your financial models and uncovering how changes in key inputs impact your results.
What is Sensitivity Analysis?
Sensitivity analysis is a technique used to see how changes in one or more input variables (like sales, costs, or interest rates) affect the outcome of a model or decision (such as profit, IRR, or share price). By systematically adjusting these inputs and observing the results, you can identify which variables have the biggest impact on the outcome and understand how sensitive your results are to changes in assumptions.
This helps businesses and analysts make better decisions, manage risk, and prepare for different scenarios.
Sensitivity analysis is often called a what-if analysis because it answers questions like: What happens if this variable goes up or down?
Key Aspects of Sensitivity Analysis:
- Input Variable Variation: Systematically change one or more input variables while holding others constant.
- Output Variable Observation: Track how these changes impact key outputs like NPV, IRR, profit, or revenue.
- Identifying Key Drivers: Pinpoint the inputs that have the most significant impact on your results.
- Understanding Uncertainty: Quantify the range of potential outcomes and assess the robustness of your model.
Why is Sensitivity Analysis Important?
Incorporating sensitivity analysis into your financial modeling process offers several benefits:
- Risk Assessment: Identify critical assumptions and uncertainties that could impact project success or financial performance.
- Improved Decision-Making: Understand how sensitive your results are to different assumptions, enabling more informed decisions.
- Enhanced Model Robustness: Identify weaknesses in your model and areas where more data or analysis is needed.
- Prioritization of Efforts: Focus on the variables that truly matter most to your financial outcomes.
- Better Communication: Present a more comprehensive view of potential outcomes to stakeholders, fostering informed discussions and buy-in.
How to Perform Sensitivity Analysis: A Step-by-Step Guide
Step 1: Identify Key Input Variables
Determine the input variables in your financial model that are most uncertain or have the potential to significantly impact outputs. Examples include:
- Sales growth rates
- Discount rates
- Cost of goods sold (COGS)
- Market size
- Project timelines
Step 2: Select Output Variables to Analyze
Choose the key output metrics you want to examine for sensitivity. Common examples include:
- Net Present Value (NPV)
- Internal Rate of Return (IRR)
- Profitability metrics (e.g., net income, EBITDA)
- Revenue
Step 3: Define Variable Ranges
For each key input variable, determine a reasonable range of values to test. This range should reflect plausible optimistic, pessimistic, and base-case scenarios. For example:
- Sales growth: -10% to +20%
- Discount rate: 8% to 12%
- COGS: ±15%
Step 4: Perform What-If Scenarios
Systematically change each input variable within its defined range, one at a time, while holding all other inputs constant. For each change, recalculate your financial model and record the resulting output variables.
Step 5: Analyze and Visualize Results
Organize and analyze the results of your sensitivity analysis. Common visualization methods include:
- Sensitivity Tables: Show how output variables change as input variables are varied.
- Spider Charts (Tornado Charts): Rank input variables based on their impact on the output variable.
- Scenario Analysis: Create distinct scenarios (e.g., Best Case, Base Case, Worst Case) by simultaneously changing multiple input variables.
Step 6: Interpret and Draw Conclusions
Analyze the results to:
- Identify the key drivers of your financial model’s outputs.
- Understand the range of potential outcomes and the level of uncertainty.
- Assess the robustness of your base-case forecast.
- Inform decision-making and risk mitigation strategies.
Performing Sensitivity Analysis in Excel
Let's dive into the core methods you can use in Excel to conduct robust sensitivity analysis.
1. Manual Data Tables (One-Way & Two-Way)
This is the most common and often easiest way to visualize the impact of changing one or two variables on a key output.
- One-Way Data Table: Shows how a single input variable affects one or more financial outputs.
- Use Case: How does a change in sales growth rate (e.g., from 5% to 15%) impact Net Present Value (NPV), Internal Rate of Return (IRR), or EBITDA?
- How to do it:
- List the different values for your single input variable in a column.
- Reference your key output formula(s) (e.g., your NPV calculation cell) in the row above the input values, one cell to the right of the first input value.
- Select the entire range (input values + output formulas).
- Go to
Data>What-If Analysis>Data Table. - In the
Column input cell:box, select the actual cell in your model that contains the original value for the input variable you are testing (e.g., your sales growth rate assumption cell). - Leave
Row input cell:blank. ClickOK. - Excel will populate the table, showing the output for each input scenario. Tip: Use Shift + F9 to refresh.
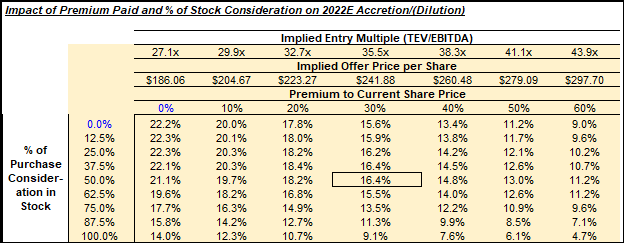
- Two-Way Data Table: Shows how two input variables simultaneously affect a single financial output.
- Use Case: How do changes in both sales price and cost of goods sold (COGS) percentage affect gross profit margin?
- How to do it:
- List the different values for your first input variable in a column.
- List the different values for your second input variable in a row, starting one cell to the right of the first input variable's list.
- In the cell where the column and row lists intersect (top-left corner), reference your key output formula (e.g., your Gross Profit Margin calculation cell).
- Select the entire range (both input lists + the output formula cell).
- Go to
Data>What-If Analysis>Data Table. - In the
Row input cell:box, select the actual cell in your model for the variable you listed in the row. - In the
Column input cell:box, select the actual cell in your model for the variable you listed in the column. ClickOK. - Excel will populate the table, showing the output for each combination of the two inputs. Tip: Use Shift + F9 to refresh.
2. Scenario Manager
When you need to analyze the impact of changing multiple input variables (more than two) simultaneously for a few distinct scenarios, Scenario Manager is your best friend.
- Use Case: You have a Base Case, Upside Case, and Downside Case for a project, each with different assumptions. You want to see the combined impact.
- How to do it:
- Go to
Data>What-If Analysis>Scenario Manager. - Click
Add...to define each scenario:- Scenario Name: Give it a descriptive name (e.g., Upside Case).
- Changing cells: Select all the input cells in your model that will change for this scenario (e.g., sales volume, price, COGS %, interest rate).
- Enter the specific values for these changing cells for the current scenario.
- Repeat for all your desired scenarios (Base, Upside, Downside).
- Once all scenarios are defined, click
Summary.... - Result cells: Select the cells containing your key outputs that you want to see for each scenario (e.g., NPV cell, Payback Period cell).
- Choose
Scenario summaryorScenario PivotTable report. ClickOK. - Excel will generate a new sheet with a table summarizing the results of your chosen outputs for all defined scenarios.
- Go to
3. Goal Seek
While not strictly sensitivity analysis in the sense of showing a range of outcomes, Goal Seek is invaluable for reverse engineering. It tells you what an input needs to be to achieve a desired output.
- Use Case: You need to achieve an IRR of 15% for a new investment. What sales volume do you need to hit to get there, assuming all other variables remain constant?
- How to do it:
- Go to
Data>What-If Analysis>Goal Seek. - Set cell: Select the cell that contains your target output formula (e.g., your IRR calculation cell).
- To value: Enter your desired target value (e.g., 0.15 for 15%).
- By changing cell: Select the single input cell you want to adjust to reach your target (e.g., your Sales Volume assumption cell).
- Click
OK. Excel will iterate to find the required input value.
- Go to
Key Considerations for Effective Excel Sensitivity Analysis
- Model Structure: Ensure your financial model is well-structured, clean, and uses clear cell references for inputs and outputs. Avoid hardcoding values within formulas.
- Identify Key Drivers: Before diving into Excel, strategically identify the most impactful and most uncertain variables relevant to your specific analysis. Don't try to analyze everything.
- Interpret Results: Which variables create the largest swings in your key outputs? These are your areas of highest risk and highest opportunity.
- Visualizations: Use charts (bar charts for scenario comparisons, line charts for continuous sensitivity) to visually represent the impact, making it easier to digest and present findings.
Examples of Sensitivity Analysis in Action
1. Project NPV Sensitivity to Discount Rate
- Input Variable: Discount rate (8% to 12%).
- Output Variable: NPV.
- Insight: Shows how sensitive the project’s viability is to changes in the cost of capital or perceived risk.
2. Revenue Sensitivity to Sales Growth and Price
- Input Variables: Sales growth rates and average selling prices.
- Output Variable: Revenue.
- Insight: Reveals the relative importance of volume versus price in driving revenue.
3. Profit Sensitivity to Cost of Goods Sold (COGS)
- Input Variable: COGS (±15%).
- Output Variable: Net income or EBITDA.
- Insight: Highlights the impact of cost fluctuations on profitability.
4. Real Estate Investment Sensitivity to Rental Rates and Occupancy
- Input Variables: Rental rates and occupancy levels.
- Output Variable: Investment return.
- Insight: Identifies the key drivers of investment performance in the property market.
Embrace The Uncertainty
Sensitivity analysis is an indispensable tool for anyone working with financial models.
By systematically exploring what-if scenarios, you can move beyond static forecasts, gain a deeper understanding of the uncertainties inherent in your assumptions, and make more robust, data-driven decisions.