The Ansoff Matrix: How Growth Strategies Create (or Destroy) Shareholder Value

Why Some Growth Strategies Create Value (and Others Destroy It)
In 2000, General Electric was the most valuable company in the world. By 2024, it had been broken into three separate businesses after decades of underperformance.
At the same time, Amazon made one of the most important capital allocation decisions in modern history: launching AWS — a business completely unrelated (on the surface) to selling books.
Both companies pursued growth.
Both expanded beyond their core.
Only one created extraordinary shareholder value.
The difference wasn’t ambition. It wasn’t scale.
It was how they chose to grow.
And that’s exactly what the Ansoff Matrix helps you understand.
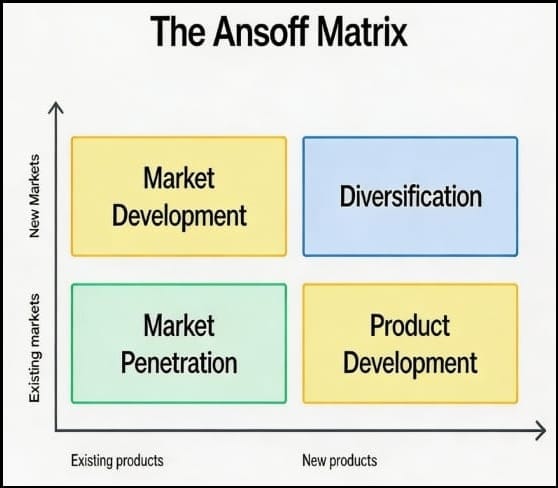
What Is the Ansoff Matrix?
The Ansoff Matrix is a strategic framework used to evaluate growth strategies based on risk.
It divides growth into four categories based on:
- Products (existing vs new)
- Markets (existing vs new)
Growth Is a Portfolio of Bets
One of the biggest mistakes investors make is treating growth as a single concept.
It isn’t.
Every company’s growth is actually a portfolio of strategic bets, each sitting in a different quadrant of the Ansoff Matrix.
For example:
- A SaaS company expanding pricing → Market Penetration
- Launching a new feature → Product Development
- Expanding to Europe → Market Development
- Acquiring a fintech startup → Diversification
Most companies are operating in multiple quadrants simultaneously.
The Four Growth Strategies
1. Market Penetration Strategy (Lowest Risk, Highest Quality)
Definition: Selling more existing products to existing customers.
How Companies Execute This:
- Price increases (pricing power)
- Increased usage (frequency or volume)
- Customer retention improvements
- Cross-selling within the same product
Real-World Example: Coca-Cola
Coca-Cola grows by:
- Increasing consumption occasions
- Expanding distribution
- Strengthening brand dominance
Market penetration is essentially optimization, not innovation.
That’s why it:
- Requires less capital
- Produces higher ROIC
- Is more predictable
This is the highest-quality growth in public markets.
Look for metrics like:
- Same-store sales
- ARPU (average revenue per user)
- Retention rates
These are direct indicators of penetration success.
2. Market Development Strategy
Definition: Selling existing products in new markets.
What Counts as a New Market?
- Geography (US → Europe)
- Demographics (enterprise → SMB)
- Channels (offline → online)
Success Case: Netflix
Netflix scaled globally because:
- Content demand is universal
- Technology scaled easily
- It localized content effectively
Failure Case: Walmart Germany
Walmart failed because:
- Cultural mismatch
- Regulatory constraints
- Strong local competition
Not all market expansion is equal.
The greater the distance between markets, the higher the risk:
- Cultural distance
- Regulatory distance
- Competitive distance
The further the leap, the closer this gets to diversification.
3. Product Development Strategy
Definition: Creating new products for existing customers.
Why This Strategy Is So Powerful:
You already have:
- Customer trust
- Distribution
- Brand equity
So the main risk is execution, not demand.
Example: Apple’s Ecosystem Strategy
Apple doesn’t just launch products. It builds ecosystems:
- iPhone → Apple Watch → AirPods → Services
Each product:
- Reinforces the others
- Increases switching costs
- Expands lifetime value
Adjacency Principle
Successful product development stays adjacent to core capabilities.
Failures happen when companies:
- Misread customer needs
- Enter unfamiliar product categories
Example Failures:
- Google+ (social network)
- Google Glass (hardware + fashion mismatch)
4. Diversification Strategy
Definition: New products in new markets.
This is the most dangerous quadrant.
Why Diversification Fails So Often:
- No Competitive Advantage
- Company starts from zero
- Capital Misallocation
- Profitable divisions fund weak ones
- Management Dilution
- Attention spread too thin
- Overconfidence Bias
- We succeeded before, so we’ll succeed again
Case Study: General Electric
GE expanded into:
- Financial services
- Media
- Multiple unrelated industries
The result:
- Lower returns
- Higher risk
- Massive value destruction
This is the classic conglomerate trap.
Why Some Diversification Works (Rare but Powerful)
Amazon’s AWS worked because it was:
- Built internally (organic growth)
- Based on existing infrastructure
- Leveraging existing technical expertise
Related vs Unrelated Diversification
| Type | Success Rate | Example |
|---|---|---|
| Related Diversification | Moderate | Amazon AWS |
| Unrelated Diversification | Low | GE Capital |
The key question:
Does this new business leverage existing capabilities?
How to Analyse Any Company Using the Ansoff Matrix
Here’s a practical framework you can apply immediately:
Step 1: Break Down Growth Sources
Identify where growth is coming from:
- Pricing? → Penetration
- New regions? → Market Development
- New features? → Product Development
- Acquisitions? → Diversification
Step 2: Assign Risk Weights
Not all revenue growth is equal.
Example:
- 70% penetration + 30% product development → High-quality growth
- 40% diversification → Red flag
Step 3: Compare to Valuation
Ask:
Is the market pricing this growth correctly?
If a company is:
- Taking high-risk bets
- But priced like low-risk growth
→ That’s potential overvaluation
Step 4: Evaluate Capital Efficiency
Use:
- ROIC (Return on Invested Capital)
- Incremental margins
- Payback periods
Higher-risk strategies should justify higher returns.
The Most Important Pattern: Growth Under Pressure
One of the most reliable warning signs in investing:
When growth slows, companies take more risk.
This leads to:
- Aggressive acquisitions
- Unrelated diversification
- Overexpansion
This is where most value destruction begins.
FAQ: Ansoff Matrix
What is the Ansoff Matrix used for?
The Ansoff Matrix is used to evaluate business growth strategies based on risk, helping companies and investors understand whether growth comes from existing or new products and markets.
Which Ansoff strategy is the least risky?
Market penetration is the lowest-risk strategy because it focuses on existing products and customers.
Why is diversification risky?
Diversification involves entering new markets with new products, which increases execution risk, capital requirements, and the likelihood of failure.
How do investors use the Ansoff Matrix?
Investors use it to:
- Analyse growth quality
- Assess capital allocation decisions
- Identify overvalued or undervalued companies
Ansoff Matrix Summary
| Strategy | Risk | Capital Required | Success Rate | Investor View |
|---|---|---|---|---|
| Market Penetration | Low | Low | High | Premium-worthy |
| Market Development | Medium | Medium | Mixed | Context-dependent |
| Product Development | Medium–High | Medium–High | Variable | Watch adjacency |
| Diversification | High | High | Low | Default skepticism |
Final Points
The Ansoff Matrix endures because it captures a simple truth:
Growth is not inherently good.
What matters is how that growth is achieved.
When a company grows by doing more of what it already does well, value compounds.
When it grows by doing something entirely new, risk compounds.
And over time, that difference shows up in returns.