The BCG Growth Share Matrix: Product Classification

Developed in the early 1970s by Boston Consulting Group (BCG), this matrix provides a straightforward yet powerful lens through which companies can analyze their product portfolios and make informed strategic choices.
The BCG Matrix classifies a company's business units or products into four categories based on two key dimensions: market growth rate and relative market share.
Plotting each product on a 2x2 grid offers a visual snapshot of its current position and potential for the future.
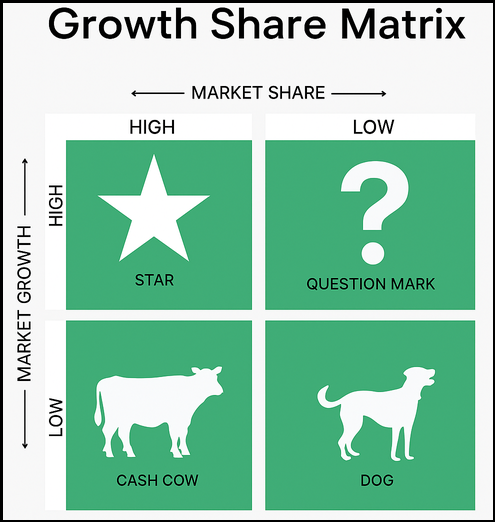
1. Stars (High Market Share, High Growth Rate)
These are your market leaders in high-growth industries.
Stars generate significant revenue but also consume large amounts of cash to maintain their growth and fend off competitors. Think of them as your future cash cows.
The strategic imperative here is to invest aggressively to solidify their market position and capitalize on growth opportunities. The aim is to ensure they remain leaders as the market matures and eventually transition into Cash Cows.
- Example: For a tech giant like NVIDIA, their AI and data center GPUs are a prime example of a Star. Operating in the rapidly growing AI and high-performance computing markets, these chips have gained significant traction and market share, requiring substantial R&D investment to maintain their technological lead and fend off emerging rivals. They consistently consume and generate vast amounts of capital as they drive the company's expansion.
2. Cash Cows (High Market Share, Low Growth Rate)
Cash Cows are the workhorses of your portfolio. They hold a dominant market share in mature, slow-growing industries.
These products generate more cash than they consume, providing a stable and reliable stream of profits. The strategy for Cash Cows is to milk them for cash with minimal further investment. This generated cash can then be strategically re-invested into Stars and promising Question Marks.
- Example: Apple's iPhone, while still a dominant product, operates in a more mature smartphone market. It's a classic Cash Cow, consistently generating immense profits that fuel other ventures and maintain the company's financial stability.
3. Question Marks (Low Market Share, High Growth Rate)
Also known as Problem Children or Wildcats, Question Marks are products in high-growth markets where the company has a low market share. They have the potential to become Stars, but they are also significant cash consumers.
The critical decision here is whether to invest heavily to grow their market share or to divest them if the potential for success is low. This quadrant demands careful analysis and calculated risks, as investing in the wrong Question Mark can quickly become a significant drain.
- Example: For a food and beverage company, a new niche health drink in a rapidly expanding wellness market, but with limited initial sales, might be a Question Mark. The company needs to decide if the investment to scale it—through increased production, distribution, and marketing—is justified by its long-term potential.
4. Dogs (Low Market Share, Low Growth Rate)
Dogs are products with a low market share in slow-growing or declining markets. They typically generate low profits or even losses and can be a drain on resources.
The general strategy for Dogs is to divest or discontinue them to free up resources that can be better allocated to more promising areas of the business.
While they might break even or offer some minor contribution, their long-term viability is questionable and they often consume management attention disproportionately to their returns.
- Example: A legacy product line that has seen dwindling demand and faces stiff competition in a stagnant market, perhaps an outdated software version or a declining physical media format, would likely be classified as a Dog.
Applying the BCG Matrix in Practice: A Step-by-Step Guide
To effectively use the BCG Matrix, follow these steps:
- Define the business units/products: Clearly identify the distinct products, services, or strategic business units (SBUs) you want to analyze.
- Calculate relative market share: This is market share relative to your largest competitor. A common approach is to divide the company's market share percentage by the largest competitor's market share percentage. A relative market share greater than 1 indicates market leadership.
- Determine market growth rate: Assess the annual growth rate of the market in which each product operates. Use industry reports, market research, and economic forecasts. High growth is typically defined as 10% or more, but this can vary by industry.
- Plot on the matrix: Place each product on the 2x2 grid according to its calculated relative market share and market growth rate. You can also represent the size of each business unit (e.g., by revenue or assets) with a circle, where the area of the circle corresponds to the business unit's sales or contribution.
- Develop strategies: Based on the quadrant each product falls into, formulate specific strategies for resource allocation, investment, and divestment for portfolio optimization.
Advantages and Limitations of the Growth Share Matrix
Advantages:
- Simplicity and Clarity: The matrix is exceptionally easy to understand and apply, providing a clear visual representation of your portfolio at a glance.
- Resource Allocation Guidance: It helps companies prioritize where to invest cash (Stars, promising Question Marks) and where to harvest or divest (Cash Cows, Dogs), optimizing resource deployment for maximum return.
- Strategic Planning Foundation: It serves as an excellent starting point for broader strategic discussions, portfolio management reviews, and even M&A considerations.
- Identifies Cash Flow Patterns: It highlights products that generate excess cash versus those that consume it, aiding financial planning and capital budgeting decisions.
- Facilitates Communication: Its simple visual nature makes complex portfolio discussions more accessible to a wider audience within an organization.
Limitations:
- Oversimplification: It only considers two dimensions (market growth and relative market share), neglecting other crucial factors like competitive intensity, brand strength, technological innovation, customer loyalty, or potential synergies between products.
- Defining Market Can Be Subjective: The definition of a market can significantly impact a product's placement. A narrow market definition might make a product appear to have high market share, whereas a broader definition would reveal a low share.
- Doesn't Account for Synergies: A Dog product might be strategically important because it complements other products, maintains customer relationships, or is essential for a complete product line, even if not profitable on its own.
- Focus on Market Share: The matrix implicitly assumes that a higher market share automatically leads to higher profitability due to economies of scale, which isn't always the case, especially in niche markets or with inefficient operations.
The Quadrants: Portfolio Management
The BCG Matrix isn't just a classification tool; it's a dynamic framework for action. Companies can actively manage their product portfolios to shift products between quadrants and optimize overall performance:
- Nurturing Question Marks: Strategic investments in R&D, aggressive marketing campaigns, expanded distribution, and market penetration efforts can transform promising Question Marks into future Stars. The key is to pick the right Question Marks with true potential and commit sufficient resources, while being prepared to cut losses on those that fail to gain traction.
- Protecting Stars: For your Stars, continuous innovation, market expansion, strong competitive defense through patents and brand building, and efficient operations are crucial to maintain their leadership position and ensure a smooth transition to Cash Cows as markets mature and growth slows.
- Optimizing Cash Cows: While they require minimal investment for growth, Cash Cows aren't entirely hands-off. Focus on maximizing their efficiency, extracting maximum value through lean operations, and leveraging their stable, significant cash flow to fund Stars and promising Question Marks. Incremental product improvements can also help sustain their market position.
- Strategic Handling of Dogs: While divestment or discontinuing the product is the common strategy, consider if a Dog serves a vital, albeit unlucrative, purpose. Does it act as a loss leader (attracting customers for other high-margin products)? Does it complete a product line, offering a full-service solution that competitors can't match? Or does it serve a small, but very loyal and high-value niche that costs little to maintain? If no such strategic value exists, then decisive action to divest or liquidate is often the best course to free up capital and management attention.
The BCG Matrix and the Product Life Cycle
It's also useful to see the BCG Matrix through the lens of the Product Life Cycle.
Often, products in their introduction phase resemble Question Marks, as they are new to the market and their future is uncertain. As they gain traction and market acceptance, they move into the growth phase and become Stars. Products in their maturity phase, with established market share and slowing growth, typically become Cash Cows. Finally, products in decline, facing obsolescence or dwindling demand, often end up as Dogs.
This interconnectedness provides a deeper understanding of a product's strategic trajectory and helps anticipate its future quadrant.
The Enduring Relevance
Despite its limitations, the BCG Growth Share Matrix remains an incredibly valuable and accessible framework for strategic thinking.
It encourages businesses to critically assess their product portfolios, understand their cash flow dynamics, and make more intentional decisions about where to focus their efforts for long-term growth and profitability.
From the perspective of an investor, companies with a healthy balance of Stars and strong Cash Cows are often seen as more sustainable and attractive than those laden with Question Marks.