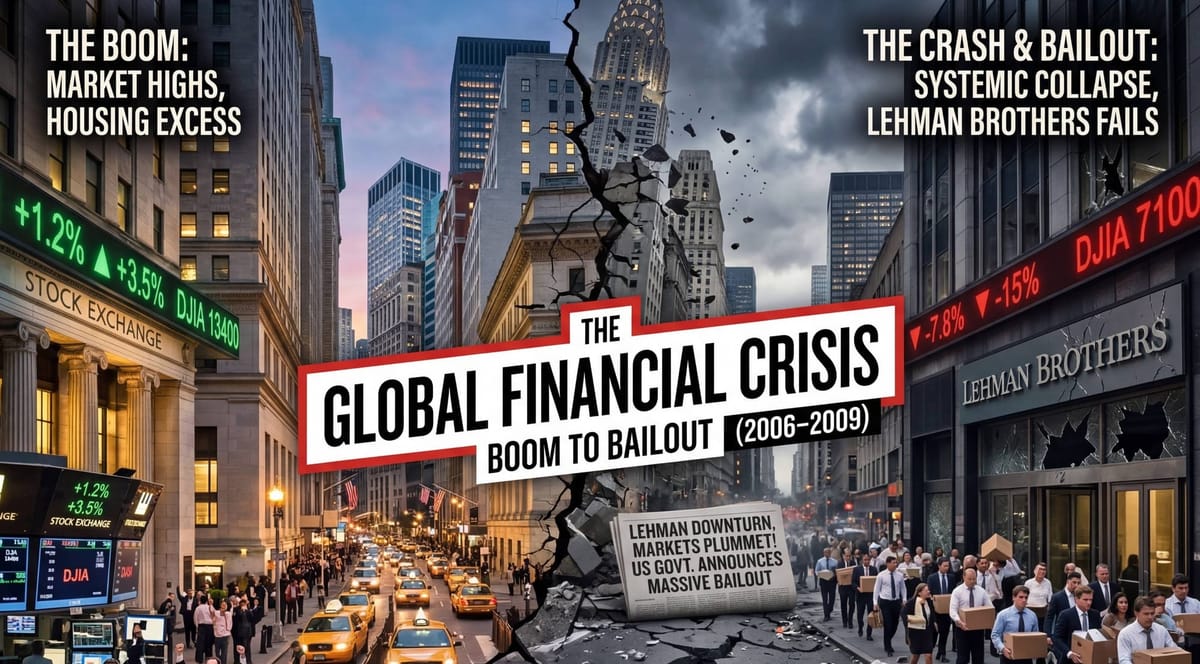
The Global Financial Crisis: Boom to Bailout (2006–2009)

What Was the Global Financial Crisis?
The Global Financial Crisis of 2007–2009 was the most severe financial and economic catastrophe to strike the developed world since the Great Depression of the 1930s.
Originating in the US subprime mortgage market—a sector that in 2006 accounted for about 20% of all new mortgages—the crisis metastasised via securitised credit products whose complexity far outstripped the capacity of regulators, rating agencies, and in many cases the banks themselves to understand.
Between its peak in October 2007 and its trough in March 2009, the S&P 500 lost 56.8% of its value, erasing approximately $11 trillion in household equity wealth in the United States alone. Global GDP contracted for the first time since the Second World War. Five of the largest US investment banks—institutions that had collectively survived world wars, the Depression, and every intervening crisis—either failed, were forcibly merged, or converted to bank holding companies within a span of eighteen months.
What Caused the Global Financial Crisis?
Easy Money, Low Rates, and the Search for Yield
By the mid-2000s, the United States was enjoying what economists had taken to calling the Great Moderation—a quarter-century run of declining macroeconomic volatility, falling inflation, and rising asset prices that had made the business cycle itself seem almost obsolete. GDP growth averaged 3.5% annually between 2003 and 2006. Unemployment fell to 4.4% by late 2006. The Federal Reserve, under Alan Greenspan and then Ben Bernanke, had cut the federal funds rate to 1.0% in June 2003—the lowest level in 45 years—in response to the post-dot-com slowdown and the shock of 11 September 2001.
The rate remained at or below 2.0% for over two years, flooding the financial system with cheap money. Even as the Fed began tightening in June 2004, raising rates in 17 consecutive quarter-point increments to 5.25% by June 2006, long-term rates barely moved. Greenspan himself called this a ‘conundrum.’ The yield curve flattened. Banks, pension funds, and insurance companies—all desperate for yield in a world where safe government bonds returned barely 4.5%—reached further and further into structured credit for returns.
The US Housing Bubble
US home prices, as measured by the Case-Shiller National Home Price Index, rose 124% between January 1997 and their peak in July 2006. In bubble epicentres—Miami, Las Vegas, Phoenix, parts of Southern California—prices had tripled. Homeownership rates hit an all-time high of 69.2% in 2004, driven not by rising incomes but by the progressive erosion of lending standards. The subprime mortgage market—loans extended to borrowers with FICO scores below 620, limited documentation, and often no down payment—grew from $160 billion in originations in 2001 to $600 billion in 2006. Alt-A mortgages, a murky category between prime and subprime, added another $400 billion. By 2006, subprime and Alt-A together accounted for roughly 40% of all new mortgage originations, up from under 10% in 2000.
The innovations were breathtaking in their recklessness. Adjustable-rate mortgages (ARMs) with teaser rates as low as 1% for the first two years. Option ARMs that allowed borrowers to choose their monthly payment, including a minimum that did not even cover interest, so the principal balance actually grew. NINJA loans—No Income, No Job or Assets—that became industry shorthand for the complete abandonment of underwriting discipline. Stated-income loans, nicknamed ‘liar’s loans,’ where the borrower simply declared their income and the lender did not verify it. A strawberry picker in Bakersfield, California, earning $14,000 a year was approved for a $720,000 mortgage. The anecdote was real, reported by the New York Times, and it captured an entire system that had lost its mind.
Securitisation, Mortgage-Backed Securities, and CDOs
What transformed a domestic housing bubble into a global financial catastrophe was securitisation—the process by which thousands of individual mortgages were pooled, sliced into tranches of varying credit quality, and sold to investors worldwide as mortgage-backed securities (MBS) and collateralised debt obligations (CDOs). The logic was simple: by pooling thousands of loans from different regions and borrower profiles, the risk of any individual default was diversified away. Rating agencies—Moody’s, Standard & Poor’s, and Fitch—duly awarded AAA ratings to the senior tranches of these structures, judging them as safe as US Treasury bonds. By 2006, the agencies were rating approximately $3 trillion in structured finance products annually. Their models assumed that home prices would not decline nationwide simultaneously—an assumption that had never been tested because it had never happened. Until it did.
The CDO machine created a fatal feedback loop. The senior AAA tranches were snapped up by pension funds, European banks, and sovereign wealth funds starved for yield. The mezzanine tranches—rated BBB—were harder to sell, so Wall Street invented the CDO-squared: a CDO whose underlying collateral was itself composed of the unsold mezzanine tranches of other CDOs. Through the alchemy of structured finance, assets rated BBB were transformed into new instruments whose senior tranches received AAA ratings. The demand for raw material—subprime mortgages—became insatiable. Originators had no reason to maintain lending standards because they sold every loan they made within weeks. The model was originate-to-distribute, and it severed the ancient link between the lender who extended credit and the borrower who owed it.
Credit Default Swaps (CDS): Insurance Without Capital
Layered atop the securitisation machine was the credit default swap (CDS) market—a vast, unregulated, over-the-counter market for what amounted to insurance contracts on bonds and structured products. By the end of 2007, the notional value of outstanding CDS contracts exceeded $62 trillion—more than the GDP of the entire world. American International Group (AIG), through its London-based Financial Products division led by Joseph Cassano, had written approximately $500 billion in CDS protection on CDOs, collecting premiums on the assumption that AAA-rated structured products would never default. AIG had posted virtually no collateral against these positions. It was, in effect, the world’s largest unregulated insurance company, and it was betting the firm on the proposition that American home prices would never fall.
Regulatory Failures Before the 2008 Crisis
The regulatory framework was hopelessly fragmented and ideologically compromised. The Commodity Futures Modernization Act of 2000, championed by Senator Phil Gramm and signed by President Clinton, had explicitly exempted over-the-counter derivatives including CDS from regulation by the Commodity Futures Trading Commission (CFTC). When Brooksley Born, chair of the CFTC, had attempted to assert jurisdiction over OTC derivatives in 1998, she was overruled by Greenspan, Treasury Secretary Robert Rubin, and SEC Chairman Arthur Levitt in a coordinated campaign that remains one of the most consequential regulatory failures in American history.
The SEC, under Christopher Cox, had in 2004 allowed the five largest investment banks—Goldman Sachs, Morgan Stanley, Merrill Lynch, Lehman Brothers, and Bear Stearns—to increase their leverage ratios from roughly 12:1 to as high as 33:1 under the Consolidated Supervised Entity programme. The Office of Thrift Supervision, responsible for overseeing AIG’s holding company, had fewer than a dozen staff assigned to the most systemically dangerous insurance operation in the world.
The Key Players
The Architects
Angelo Mozilo, co-founder and CEO of Countrywide Financial, was the public face of the subprime lending boom. Perpetually tanned, relentlessly salesmanlike, Mozilo had built Countrywide from a two-man operation in 1969 into the largest mortgage lender in the United States, originating one in five American home loans by 2006. His thesis was simple and, for years, enormously profitable: homeownership was a fundamental American right, lending standards could be relaxed because home prices always rose, and the risk could be passed on to Wall Street through securitisation. Privately, Mozilo’s emails told a different story. In internal messages later obtained by the SEC, he described some of Countrywide’s own loan products as ‘toxic’ and ‘poison.’ He sold $140 million in Countrywide stock between 2004 and 2008 through pre-arranged trading plans. In 2010, Mozilo settled SEC fraud and insider trading charges for $67.5 million without admitting guilt—one of the few senior executives to face any personal financial consequence.
Richard Fuld, Chairman and CEO of Lehman Brothers, embodied the hubris of Wall Street’s leveraged era. Known as ‘the Gorilla’ for his aggressive temperament, Fuld had led Lehman through the LTCM crisis, the dot-com bust, and the post-9/11 downturn, building the firm into the fourth-largest US investment bank with over $600 billion in assets. His fatal error was doubling down on commercial real estate and mortgage-backed securities through 2007 and into 2008, even as rival firms began to de-risk. By spring 2008, Lehman’s leverage ratio exceeded 30:1, and its portfolio of illiquid real estate assets dwarfed its equity base. Fuld rejected multiple opportunities to raise capital or sell the firm at a discount, convinced that the market was wrong and that Lehman would survive as an independent entity. When the firm filed for bankruptcy on 15 September 2008—the largest bankruptcy in American history at $639 billion in assets—Fuld’s personal fortune, once estimated at over $1 billion, was largely destroyed.
Joseph Cassano, head of AIG Financial Products (AIGFP) in London, is perhaps the single individual most responsible for the scale of the crisis. From a windowless office in Mayfair, Cassano directed the writing of hundreds of billions of dollars in credit default swaps on CDOs, generating an estimated $5 billion in cumulative premiums for AIG. His models—which he defended with volcanic intensity in internal meetings—assumed that the senior tranches of CDOs would never suffer losses sufficient to trigger payouts. When an AIGFP risk manager named Gene Park raised concerns in 2005, Cassano threatened to fire him. AIG forced Cassano out in February 2008 with a $1 million per month consulting contract. Six months later, the US government would spend $182 billion to rescue the company.
The Wall Street CDO desks at Citigroup, Merrill Lynch, Bear Stearns, and Deutsche Bank operated as the assembly line of the crisis. Citigroup under CEO Charles ‘Chuck’ Prince held over $43 billion in CDO exposure on its balance sheet, much of it in off-balance-sheet vehicles called structured investment vehicles (SIVs) that were designed to circumvent capital requirements. Prince’s infamous remark to the Financial Times in July 2007 captured the collective madness with perfect precision.
“As long as the music is playing, you’ve got to get up and dance.”
— Charles ‘Chuck’ Prince, CEO of Citigroup, Financial Times, July 2007
Investors and Economists Who Warned About the Crisis
Michael Burry, a former neurologist turned hedge fund manager running Scion Capital in Cupertino, California, was among the first investors to identify the fragility of the subprime market. By late 2004, Burry was reading individual mortgage loan prospectuses—the actual underlying documentation that almost nobody on Wall Street was examining—and concluding that a wave of defaults was inevitable once teaser rates reset.
He persuaded Goldman Sachs and Deutsche Bank to create custom credit default swaps allowing him to short specific subprime MBS tranches. Between 2005 and 2007, his investors revolted, demanding he close the positions. He refused, eventually gating redemptions. When the trades paid off in 2007 and 2008, Scion generated returns of 489.3% (net of fees and expenses) from its inception in November 2000 to June 2008.
John Paulson, a merger-arbitrage specialist with no prior experience in mortgage markets, made the single largest trade in financial history. Working with his analyst Paolo Pellegrini—who constructed a database of US home prices going back decades and concluded that the market was in an unprecedented bubble—Paulson raised a dedicated fund in 2006 to short subprime via CDS. The Paulson Advantage Fund returned 590% in 2007. Paulson himself earned approximately $3.7 billion that year—more than the GDP of several small nations.
Raghuram Rajan, chief economist of the International Monetary Fund, delivered a paper at the 2005 Jackson Hole symposium—a gathering of central bankers, academics, and policymakers held in honour of Alan Greenspan’s impending retirement—arguing that financial innovation and incentive structures were making the system more fragile, not safer. The response was hostile. Former Treasury Secretary Lawrence Summers called Rajan’s warnings ‘Luddite’ and ‘misguided.’ The episode remains a canonical example of how institutional consensus can suppress inconvenient analysis.
The Regulators
Alan Greenspan, Federal Reserve Chairman from 1987 to 2006, bears substantial intellectual responsibility. His doctrine of regulatory minimalism—that markets were self-correcting and that financial institutions, motivated by self-interest, would manage their own risk more efficiently than any regulator could mandate—provided the ideological framework for the deregulation that enabled the crisis. Under Greenspan, the Fed had explicit authority under the Home Ownership and Equity Protection Act of 1994 to regulate mortgage lending practices and chose not to exercise it. In October 2008, testifying before Congress, Greenspan admitted he had found ‘a flaw’ in his ideology—that the self-interest of lending institutions did not, in fact, protect their shareholders or the public. It was one of the most consequential admissions in the history of central banking.
Ben Bernanke, who succeeded Greenspan in February 2006, inherited the housing bubble at or near its peak and initially underestimated its systemic implications. In May 2007, he stated publicly that the problems in the subprime market were ‘likely to be contained.’ He was wrong. But Bernanke, an academic whose scholarly expertise was the Great Depression, proved to be the right person in the right crisis—deploying extraordinary and unprecedented monetary interventions including emergency lending facilities, the rescue of Bear Stearns, and eventually quantitative easing on a scale never before attempted. His counterpart at the New York Fed and later Treasury Secretary, Timothy Geithner, and Treasury Secretary Henry ‘Hank’ Paulson (former Goldman Sachs CEO), formed the crisis-management triumvirate whose ad hoc weekend decisions in September and October 2008 determined which firms lived and which died.
Sheila Bair, Chair of the Federal Deposit Insurance Corporation (FDIC), was one of the few regulators who had warned early about deteriorating mortgage standards. She clashed repeatedly with Geithner and Paulson over the terms of bank bailouts, arguing for greater accountability and for wiping out shareholders of failed institutions rather than propping them up. Her memoirs provide some of the most candid accounts of intra-governmental conflict during the crisis.
Institutions and Households Hit Hardest by the Crisis
Bear Stearns, the fifth-largest US investment bank, was the first major casualty. Its two hedge funds specialising in subprime CDOs collapsed in June 2007, wiping out $1.6 billion. By March 2008, a classic bank run—clients and counterparties simultaneously withdrawing funds and refusing to roll over short-term financing—left the firm days from insolvency. The Federal Reserve brokered an emergency sale to JPMorgan Chase, initially at $2 per share (later raised to $10) for a firm that had traded above $170 just twelve months earlier.
The American homeowner was the ultimate casualty. Between 2007 and 2010, approximately 3.8 million foreclosure filings were processed annually. Home prices nationally fell 33% from peak to trough. In Las Vegas, the decline exceeded 60%. An estimated 11 million homeowners—roughly one in four with a mortgage—found themselves underwater, owing more on their homes than the properties were worth. The wealth destruction was concentrated in Black and Hispanic households, which had been disproportionately targeted by subprime lenders, erasing a generation of gains in minority wealth accumulation.
Global casualties extended far beyond US borders. Northern Rock in the United Kingdom, the first bank run in Britain since 1866. Iceland, whose three largest banks—Kaupthing, Landsbanki, and Glitnir—had combined assets of over ten times the nation’s GDP and all failed within a week. Ireland, whose blanket bank guarantee in September 2008 ultimately cost the sovereign roughly €64 billion and required an EU-IMF bailout. The crisis demonstrated with brutal clarity that in a globalised financial system, structured credit products sold from trading desks in New York and London could devastate economies half a world away.
Timeline of the Global Financial Crisis
Early Warning Signs in 2006 and 2007
The crisis did not arrive with a single thunderclap. It built slowly, like a structure fire burning inside walls before bursting through the roof. US home prices peaked nationally in July 2006. Subprime delinquencies began rising in late 2006 as the first wave of 2004-vintage adjustable-rate mortgages hit their reset dates, with monthly payments jumping 30–50%. New Century Financial, the second-largest subprime lender, disclosed accounting irregularities in February 2007 and filed for bankruptcy in April. The market shrugged. In June 2007, two hedge funds managed by Bear Stearns—the High-Grade Structured Credit Strategies Fund and the High-Grade Structured Credit Strategies Enhanced Leveraged Fund—reported catastrophic losses on CDO positions, ultimately losing $1.6 billion. Merrill Lynch, which had lent money to the funds, seized and tried to auction their CDO collateral. The auction failed: there were no buyers at any price. This was the first public demonstration that large swathes of the structured credit market were essentially illiquid—that the assets rated AAA by the agencies could not be sold at anything close to their marks.
On 9 August 2007, BNP Paribas, France’s largest bank, froze three investment funds worth €1.6 billion, stating that it could not value the subprime-linked assets they held. The European Central Bank injected €95 billion into the banking system the same day—the largest single-day liquidity operation in its history. This date, not the Lehman bankruptcy thirteen months later, was arguably the true start of the global financial crisis. It was the moment that the interbank lending market—the short-term funding on which the entire global banking system depended—began to seize up. Banks stopped trusting each other. The London Interbank Offered Rate (LIBOR), which had typically tracked the Fed funds rate closely, began to diverge sharply. The TED spread—the gap between three-month LIBOR and the three-month Treasury bill rate, a key measure of banking system stress—doubled in August 2007 and would eventually spike to over 450 basis points.
The Northern Rock Run: September 2007
On 14 September 2007, television cameras captured scenes not seen in Britain since the Victorian era: queues of depositors stretching around the block outside branches of Northern Rock, a Newcastle-based mortgage lender that had funded its aggressive lending through wholesale markets rather than retail deposits. When wholesale funding dried up in August, Northern Rock had nowhere to turn. The Bank of England, under Governor Mervyn King, initially refused to provide emergency liquidity support on principle—moral hazard, he argued—before relenting when the run accelerated. The government ultimately nationalised Northern Rock in February 2008, the first British bank nationalisation since the 1970s.
Bear Stearns: March 2008
Bear Stearns’ collapse in March 2008 was a template for the panic that would consume the system six months later. On Monday 10 March, rumours circulated that the firm was running low on cash. By Wednesday, clients were pulling prime brokerage accounts. On Thursday evening, Bear’s CEO Alan Schwartz went on CNBC to reassure the market. On Friday 14 March, the liquidity was gone.
Over a frantic weekend, the Federal Reserve brokered a sale to JPMorgan Chase, providing $29 billion in non-recourse financing to sweeten the deal. The initial price of $2 per share for a firm that had been worth $20 billion a year earlier shocked the market. It also established a fateful precedent: the government would intervene to prevent a disorderly failure of a systemically important firm.
September 2008: Lehman, AIG, and Peak Panic
The six months between Bear’s rescue and September 2008 were a slow-motion deterioration. Fannie Mae and Freddie Mac, the government-sponsored enterprises that guaranteed roughly $5 trillion in mortgage debt, saw their share prices collapse as losses mounted. On 7 September, Treasury Secretary Paulson placed both into government conservatorship—the largest government intervention in financial markets to date.
One week later, everything fell apart. Over the weekend of 13–14 September, Paulson, Geithner, and Bernanke convened the CEOs of Wall Street’s surviving banks at the New York Federal Reserve to find a buyer for Lehman Brothers, which was haemorrhaging cash and counterparty confidence. Bank of America, initially interested, pivoted to acquiring Merrill Lynch instead. Barclays made an offer but withdrew when UK regulators refused to waive shareholder approval requirements. Paulson, scarred by political criticism of the Bear Stearns rescue and concerned about moral hazard, declined to provide government support. At 1:45 am on Monday 15 September 2008, Lehman Brothers filed for Chapter 11 bankruptcy—$639 billion in assets, the largest bankruptcy in history.
The consequences were immediate and catastrophic. The Reserve Primary Fund, a $62 billion money-market fund with $785 million in Lehman commercial paper, ‘broke the buck’ on 16 September—its net asset value fell below $1.00 per share, triggering panic across the $3.5 trillion money-market fund industry. Institutional investors rushed to redeem. Within days, over $300 billion had fled money-market funds, threatening to freeze the commercial paper market that provided short-term financing to corporations across America.
On 16 September—one day after Lehman’s bankruptcy—the Federal Reserve extended an $85 billion emergency credit line to AIG, which was facing demands for tens of billions in collateral on its CDS positions as the value of the CDOs it had insured collapsed. The government ultimately committed $182 billion to AIG’s rescue, receiving 79.9% equity ownership in return. The contradictions were staggering: Lehman was allowed to fail while AIG, an insurance company rather than a bank, received the largest government rescue in history. The logic was counterparty risk: AIG’s CDS contracts were held by every major bank on the planet, and its failure would have triggered a cascading daisy chain of losses across the entire global financial system.
TARP and the Panic’s Climax: October 2008
On 29 September, the US House of Representatives rejected the Troubled Asset Relief Program (TARP)—a $700 billion bailout package proposed by Paulson—on its first vote. The Dow Jones Industrial Average fell 778 points, its largest single-day point decline in history. Members of Congress reported that their phone lines melted with calls from constituents running 100-to-1 against the bailout. The bill passed on a second vote on 3 October, but by then the panic had crossed the Atlantic. On 8 October, the UK government announced a £500 billion bank rescue package, partially nationalising Royal Bank of Scotland, Lloyds TSB, and HBOS. Iceland’s banking system collapsed entirely. Ireland issued a blanket guarantee of bank liabilities. The German government rescued Hypo Real Estate.
On 13 October, Paulson summoned the CEOs of the nine largest US banks to the Treasury and effectively compelled them to accept $125 billion in government capital injections under TARP, regardless of whether individual banks claimed to need the money. The logic was that if only weak banks accepted capital, it would stigmatise them and accelerate their failure. Every CEO signed. Paulson’s gambit worked: the immediate panic ebbed, but the economic damage was already cascading through the real economy.
The S&P 500 would not reach its ultimate trough until 9 March 2009, when it closed at 676.53—down 56.8% from its October 2007 peak of 1,565.15. The VIX volatility index had spiked to 89.53 on 24 October 2008, the highest reading in its history. Global equity markets had lost approximately $33 trillion in value from their 2007 peaks.
Aftermath of the Global Financial Crisis
The Economic Devastation
The human cost was staggering. US unemployment peaked at 10.0% in October 2009, with the real rate—including discouraged workers and those forced into part-time employment—reaching approximately 17%. Eight million Americans lost their jobs between 2007 and 2010. US GDP contracted 4.3% from the fourth quarter of 2007 to the second quarter of 2009, the deepest recession since the Depression. Median household wealth fell 39% between 2007 and 2010, from $126,400 to $77,300, according to the Federal Reserve’s Survey of Consumer Finances. The recovery was the slowest since the 1930s: it took until 2014 for total employment to regain its pre-crisis level, and median household income did not recover until 2016.
The Policy Response
The scale of policy intervention was unprecedented. The Federal Reserve cut the federal funds rate from 5.25% to a target range of 0–0.25% between September 2007 and December 2008, exhausting conventional monetary policy. It then embarked on quantitative easing (QE)—large-scale purchases of mortgage-backed securities and Treasury bonds—ultimately expanding its balance sheet from roughly $900 billion to over $4.5 trillion across three rounds of QE between 2008 and 2014. The fiscal response included the American Recovery and Reinvestment Act of 2009, a $787 billion stimulus package. TARP, initially authorised at $700 billion, ultimately deployed approximately $431 billion, of which the Treasury eventually recovered roughly $441 billion—a modest nominal profit, though critics note this ignores the opportunity cost of capital and the moral hazard created.
Regulatory Reform
The Dodd-Frank Wall Street Reform and Consumer Protection Act, signed into law in July 2010, was the most comprehensive financial regulation since the New Deal. Its key provisions included: the Volcker Rule, restricting proprietary trading by deposit-taking banks; the creation of the Consumer Financial Protection Bureau (CFPB); mandatory central clearing for standardised derivatives; enhanced capital and liquidity requirements for systemically important financial institutions (SIFIs); the establishment of the Financial Stability Oversight Council (FSOC) to monitor systemic risk; and the Orderly Liquidation Authority, giving regulators a mechanism to wind down failing firms without the chaos of the Lehman bankruptcy. Internationally, the Basel III accords raised minimum capital ratios, introduced the leverage ratio, and created new liquidity coverage requirements.
Legal and Institutional Consequences
The legal reckoning was, by almost any measure, inadequate. No senior executive at a major Wall Street bank served prison time for conduct related to the crisis. The Department of Justice, under Attorney General Eric Holder, pursued deferred prosecution agreements and civil settlements rather than criminal prosecutions of individuals. JPMorgan Chase paid $13 billion. Bank of America paid $16.65 billion. Citigroup paid $7 billion. In total, the six largest US banks paid over $110 billion in mortgage-related fines and settlements between 2008 and 2016—sums that were large in absolute terms but represented a small fraction of the damage inflicted and were paid by shareholders rather than the individuals responsible. The contrast with the savings-and-loan crisis of the late 1980s, which produced over 1,000 criminal convictions, remains one of the most debated aspects of the GFC’s legacy.
Market Recovery
The S&P 500’s recovery from its March 2009 trough was one of the most powerful bull markets in history, driven by zero interest rates, quantitative easing, and the gradual repair of corporate balance sheets. The index reclaimed its October 2007 peak in March 2013—roughly five and a half years after the crisis began. Housing recovery was far slower: the Case-Shiller National Index did not regain its 2006 peak until 2016, and in some hard-hit markets, prices remained below their bubble peaks for a decade or more. The recovery was also profoundly unequal. Asset owners—those with equity portfolios, property, and pension entitlements—benefited enormously from the policy response. Workers, renters, and those who had lost homes to foreclosure experienced a recovery that felt like none at all.
Investor Lessons From the Global Financial Crisis
Lesson One: Complexity Is Not Diversification
The central fallacy of the structured credit boom was that financial engineering could transform bad credit into good credit. CDOs did not eliminate the risk of subprime mortgages; they obscured and concentrated it. The lesson for investors is permanent: when you cannot independently verify the underlying risk of an instrument, you do not understand the instrument, regardless of its rating. Today’s equivalents include certain segments of the private credit market, where assets-under-management have grown from roughly $500 billion in 2008 to over $1.7 trillion by 2024, with limited transparency on mark-to-market valuations and increasing use of fund-level leverage.
Lesson Two: Liquidity Is a Fair-Weather Friend
Every structured product marketed during the boom was sold with the implicit assumption that it could be sold in a secondary market. When the crisis hit, the markets for CDOs, CMBS, and even highly-rated agency MBS froze. Assets that were ‘liquid’ in benign conditions became un-sellable at any price. The modern parallel is vivid: open-ended funds investing in illiquid assets—commercial property funds, private credit vehicles, certain high-yield bond strategies—face the same fundamental maturity mismatch. When investors can redeem daily from a fund that holds assets trading weekly or monthly, the first movers are rewarded and the last are destroyed.
Lesson Three: Incentive Structures Are the Best Leading Indicator
The originate-to-distribute model removed all incentive for mortgage originators to maintain lending standards. Loan officers were compensated on volume, not on the subsequent performance of their loans. Rating agencies were paid by the issuers whose products they rated. Bankers received annual bonuses based on revenues generated by positions whose risks would not materialise for years. When you see an industry where the people making the decisions bear none of the consequences of those decisions, the question is not whether a crisis will occur but when. In today’s markets, investors should scrutinise incentive structures in private equity (where fee structures can reward deal-making over returns), in SPACs and de-SPACs (where sponsors profit regardless of shareholder outcomes), and in the leveraged loan market (where covenant-lite issuance has reached levels that exceed the pre-2008 peak).
Lesson Four: Leverage Is the Universal Amplifier
Every major financial crisis in modern history—from 1929 to 2008—has featured leverage as the transmission mechanism that converts asset-price declines into systemic crises. The GFC added a new dimension: hidden leverage, embedded in off-balance-sheet vehicles (SIVs), in derivatives exposures (AIG’s CDS book), and in the very structure of the instruments themselves (CDO-squareds). The Basel III reforms addressed bank leverage directly, but leverage has migrated to less regulated corners of the financial system—hedge funds, private credit, and family offices. Archegos Capital Management’s $30 billion collapse in March 2021, driven by total return swaps that concealed its concentrated positions from its prime brokers, was a direct echo of pre-2008 dynamics.
Lesson Five: The Policy Response Determines the Distribution of Losses
The GFC demonstrated that in a systemic crisis, the government will intervene—but the form of intervention determines who bears the losses. Shareholders of Bear Stearns and Lehman lost nearly everything. AIG’s shareholders were diluted to near-zero but the company survived. Bank bondholders were generally made whole. Homeowners received limited and belated assistance. The lesson for sophisticated investors is to think carefully about where they sit in the capital structure of systemically important institutions and how policy incentives will shape the resolution of the next crisis. The post-GFC playbook—bail out the system, penalise equity, protect debt—has become the template, and investors should price accordingly.
The Contrarian’s Playbook
With perfect hindsight, the optimal trade was straightforward: short subprime MBS through CDS beginning in 2005–2006, cover the shorts and pivot to long positions in high-quality equities and distressed credit in early 2009. In reality, this was extraordinarily difficult. Burry’s investors nearly forced him to liquidate his shorts in 2006 and 2007 as the positions bled carry. Paulson had to raise a dedicated fund because his existing investors would not have tolerated the negative carry.
The lesson is that being early is indistinguishable from being wrong for as long as the timing is uncertain.
Investment Principles
I. Bubble Mechanics
Principle 1: The Originate-to-Distribute Fallacy
When the entity extending credit has no stake in whether it is repaid, underwriting standards will collapse. The GFC’s mortgage machine severed accountability from risk-taking. The pattern recurs wherever fees are earned upfront on assets whose performance materialises over years.
Operational Rule: Before investing in any credit product, identify who retains first-loss exposure. If the answer is ‘nobody’ or ‘the end buyer,’ reduce your allocation or avoid entirely.
Principle 2: Rating Agency Dependency Is a Leading Indicator of Fragility
When an asset class’s demand is driven primarily by its rating rather than by independent credit analysis, mispricing is inevitable. The agencies rated $3 trillion in structured products annually using models that assumed nationwide home prices could not fall simultaneously. Whenever you hear ‘it’s AAA-rated’ as the primary investment thesis, the risk is already mispriced.
Operational Rule: Never use a third-party rating as a substitute for your own credit analysis. If a position’s inclusion in your portfolio depends on its rating, you do not understand the position.
Principle 3: Correlation Assumptions Break in Crisis
Diversification models that assume stable correlations will fail precisely when diversification matters most. The CDO model assumed regional housing markets were uncorrelated; in a nationwide downturn driven by a common factor (loose lending standards), correlations spiked to 1.0. This pattern holds across asset classes: in a systemic crisis, everything becomes correlated except cash and sovereign bonds.
Operational Rule: Stress-test portfolios using correlation assumptions of 0.8–1.0 across risky assets, not the 0.3–0.5 that characterises benign periods. Size positions so the portfolio survives the stress scenario without forced liquidation.
II. Warning Signs
Principle 4: When Leverage Becomes the Return, the Cycle Is Late
By 2006, the only way to generate competitive returns in structured credit was to add more leverage—CDO-squareds, leveraged SIVs, higher loan-to-value ratios. When an asset class can only deliver its historical returns at ever-higher leverage ratios, the risk-adjusted return has already deteriorated. The leverage is masking the absence of genuine yield.
Operational Rule: Track the leverage embedded in any strategy or asset class you own. If leverage has doubled to maintain the same nominal return, cut the position by half.
Principle 5: New Acronyms Are a Contrarian Signal
CDO, CDO-squared, SIV, ABCP, NINJA, Option ARM. The proliferation of new financial acronyms is a reliable signal that complexity is being used to obscure risk. When an industry needs new vocabulary to describe what it is selling, the simplest explanation is that the old vocabulary would have made the risks too obvious.
Operational Rule: When you encounter a financial product you cannot explain in two sentences to a non-specialist, do not invest. If the entire market is buying it anyway, begin reducing your risk exposure.
Principle 6: Watch the Funding Markets, Not the Asset Markets
The crisis was visible in money markets months before it appeared in equity markets. The BNP Paribas fund freeze in August 2007, the spike in LIBOR-OIS spreads, the seizing of the asset-backed commercial paper market—all occurred while the S&P 500 was still within 10% of its all-time high. Funding stress is the earliest and most reliable signal of systemic risk.
Operational Rule: Monitor LIBOR-OIS (or SOFR-OIS) spreads, commercial paper spreads, and money-market fund flows weekly. When these diverge sharply from equity market complacency, increase cash and reduce illiquid positions.
III. Portfolio & Risk Management
Principle 7: Liquidity Must Be Measured Under Stress, Not Calm
Every CDO prospectus assumed a liquid secondary market. None existed when it mattered. The GFC proved that liquidity is a function of market conditions, not of the instrument itself. A corporate bond that trades daily in normal markets may not trade for weeks in a crisis.
Operational Rule: For every position, estimate the liquidation timeline under stress conditions (assume bid-offer spreads widen 5–10x and trading volumes fall 80%). If you cannot liquidate within your fund’s redemption cycle, size the position to no more than 5% of portfolio NAV.
Principle 8: Counterparty Risk Is Portfolio Risk
AIG’s collapse demonstrated that insurance purchased from an impaired counterparty is not insurance at all. The $62 trillion CDS market had concentrated massive exposures in a handful of institutions, creating a web of interconnected risk that no individual firm could fully map.
Operational Rule: Limit exposure to any single counterparty to no more than 5% of portfolio value. Require daily mark-to-market and adequate collateral posting on all OTC derivative positions. Know your counterparty’s counterparties.
Principle 9: Maintain a Permanent Liquidity Reserve
Investors who held meaningful cash and short-duration bonds through the crisis—even though those assets dragged on returns during the boom—were the only ones positioned to buy distressed assets at generational prices in 2008–2009. The opportunity cost of holding cash is real but finite; the cost of being forced to sell in a panic is potentially total.
Operational Rule: Maintain a minimum of 10–15% of portfolio NAV in cash and Treasury bills. During periods of rising systemic risk indicators, increase to 20–25%. This is not a market-timing call; it is insurance.
IV. Psychological Discipline
Principle 10: Consensus Is Most Dangerous When It’s Most Comfortable
In 2006, the consensus was that US home prices could not decline nationally, that structured products had distributed risk efficiently, and that the Great Moderation had permanently reduced the risk of severe recessions. Every element of this consensus was wrong. The more comfortable a consensus view feels, the less likely that the associated risks are priced.
Operational Rule: Identify the consensus view on any major position or macro theme you hold. Then invert it: what would happen if the consensus is exactly wrong? If the answer is ‘catastrophic losses,’ reduce the position regardless of how confident you feel.
Principle 11: Being Early Is Indistinguishable from Being Wrong
Michael Burry shorted subprime in 2005 and was right—but his investors nearly forced him out in 2006 and 2007 as the shorts bled. The lesson is that conviction about direction is insufficient; you must also have the structural capacity to endure being early. Permanent capital, locked-up funds, or modest position sizing are all ways to buy the time that correctness requires.
Operational Rule: Size contrarian positions so that you can sustain two years of adverse carry or mark-to-market losses without being forced to liquidate. If you cannot afford to be early, you cannot afford to be contrarian.
Principle 12: In a Crisis, Act on Probabilities, Not Outcomes
The weekend of Lehman’s bankruptcy, no one knew whether the government would intervene. Paulson chose not to bail out Lehman; 24 hours later, he bailed out AIG. The decisions were made under radical uncertainty. For investors, the lesson is to build portfolios that are robust across a range of scenarios rather than optimised for a single expected outcome.
Operational Rule: Run scenario analysis across at least four states—baseline, recession, crisis, and recovery—and ensure no single scenario produces a drawdown exceeding your maximum tolerable loss. If one scenario threatens ruin, restructure before it materialises.
Key Data Table
|
Metric |
Value |
|
Crisis period |
August 2007 – March 2009 (market trough) |
|
Peak-to-trough decline
(S&P 500) |
−56.8% (Oct 2007 – Mar
2009) |
|
Duration of decline |
17 months |
|
Time to full recovery
(S&P 500) |
5.5 years (March 2013) |
|
Peak investment bank leverage |
30–33:1 (Lehman, Bear Stearns) |
|
Fed funds rate at peak |
5.25% (June 2006) |
|
Fed funds rate at trough |
0–0.25% (December 2008) |
|
Estimated US household
wealth destroyed |
$11 trillion in equity
wealth; $6 trillion in housing wealth |
|
Global equity market losses (peak to trough) |
~$33 trillion |
|
US unemployment peak |
10.0% (October 2009) |
|
Home price decline (national) |
−33% peak to trough (Case-Shiller) |
|
US foreclosures
(2007–2010) |
~3.8 million annually |
|
CDS market notional outstanding (2007) |
$62 trillion |
|
AIG government rescue
cost |
$182 billion committed |
|
TARP deployed / recovered |
$431 billion / ~$441 billion |
|
Major bank fines &
settlements (2008–2016) |
>$110 billion (six
largest US banks) |
|
Key institutional failures |
Lehman Brothers, Bear Stearns, Washington Mutual, Countrywide,
Northern Rock, Icelandic banks |
|
Major regulatory reforms |
Dodd-Frank Act (2010),
Basel III, Volcker Rule, CFPB creation, FSOC creation |