Maximizing Portfolio Potential: A Complete Guide to the McKinsey GE Matrix

The McKinsey GE Matrix is a proven tool to prioritize investments, allocate resources, and maximize portfolio performance.
More robust than the Boston Consulting Group (BCG) Matrix, the McKinsey GE Matrix offers a nuanced, multi-factor approach that helps organizations make smarter, data-driven strategic decisions.
What is the McKinsey GE Matrix?
The McKinsey GE Matrix (also called the Nine-Box Matrix) was developed in the 1970s by McKinsey & Company for General Electric. GE needed a more sophisticated portfolio analysis tool than the simpler BCG Matrix, one that could evaluate multiple business units across diverse industries.
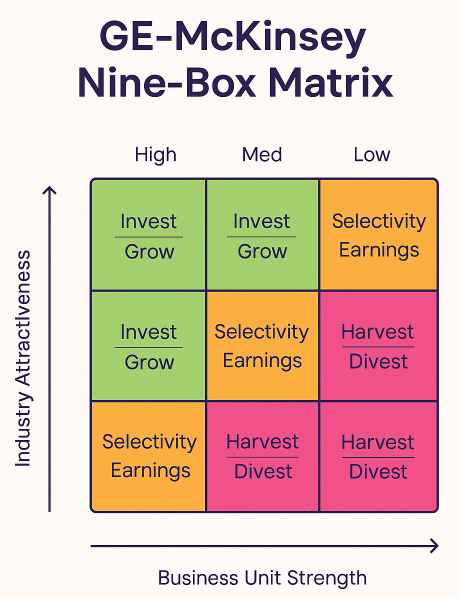
The GE Matrix is a 3×3 grid that plots business units on two dimensions:
- Industry Attractiveness (Y-axis)
- Business Unit Strength / Competitive Position (X-axis)
Each axis is divided into High, Medium, and Low, creating nine possible positions. Where a business unit lands determines the recommended strategic action—invest, maintain, or divest.
Key Components of the GE Matrix
1. Industry Attractiveness (Y-Axis)
This dimension evaluates how appealing an industry is for investment. It uses a weighted score based on factors such as:
- Market size and growth rate
- Industry profitability
- Level of competition (using tools like Porter’s Five Forces)
- Technological change
- Regulatory environment
2. Business Unit Strength / Competitive Position (X-Axis)
This measures a company’s ability to compete successfully within an industry. Factors include:
- Market share
- Brand equity and customer loyalty
- Relative profit margins
- Sustainable competitive advantages (using VRIO analysis)
- Strength of operations, supply chain, and production capacity
Strategic Implications: The Nine Boxes
The nine cells of the GE Matrix are grouped into three strategic zones:
🟢 Invest/Grow (The Green Zone)
- High Attractiveness + High Strength
- Units in this zone should receive significant investment to expand market share and capture growth.
🟠 Selectivity/Earnings (The Yellow/Orange Zone)
- Medium Attractiveness and/or Medium Strength
- A selective strategy is recommended - invest selectively, maintain position, or focus on profit maximization.
🔴 Harvest/Divest (The Red Zone)
- Low Attractiveness + Low Strength
- These units typically require a harvest or divest strategy - minimizing investment, running for cash, or selling off.
How to Use the McKinsey GE Matrix (Step-by-Step)
- Determine Industry Attractiveness: Score each industry using weighted factors like growth, profitability, and competition.
- Evaluate Competitive Strength: Score each business unit’s ability to compete using factors like market share and brand equity.
- Apply Consistent Scoring: Ensure weights and scales (e.g., 1–10) are consistent across all units.
- Plot on the Matrix: Place each business unit according to attractiveness (Y-axis) and strength (X-axis).
- Analyze Future Direction: Use complementary tools like SWOT and PESTEL to validate positioning and account for risks.
- Allocate Resources: Decide where to invest, maintain, or divest - and translate insights into actionable goals, budgets, and KPIs.
GE Matrix vs. BCG Matrix: Key Differences
| Feature | McKinsey GE Matrix | BCG Matrix |
|---|---|---|
| Purpose | Portfolio prioritization and capital allocation | Resource allocation by growth-share |
| Dimensions | Industry Attractiveness × Business Strength | Market Growth Rate × Relative Market Share |
| Grid Size | 3×3 (Nine Boxes) | 2×2 (Four Quadrants) |
| Output | Invest, Selectivity, Harvest/Divest | Stars, Cash Cows, Question Marks, Dogs |
| Advantage | Nuanced and multi-factor | Simple and easy to apply |
The GE Matrix provides a more comprehensive and flexible view, especially for diversified corporations, by using multiple weighted factors instead of just two metrics.
Advantages and Disadvantages of the McKinsey GE Matrix
Advantages:
- Considers multiple factors (not just growth and share)
- Provides clearer resource allocation guidance
- Adaptable to different industries and corporations
Disadvantages:
- More complex to build (requires significant data)
- Scoring can be subjective
- May oversimplify reality if weights are poorly assigned
FAQs: McKinsey GE Matrix
Q: What is the main purpose of the GE Matrix?
A: To help organizations decide where to invest, maintain, or divest based on portfolio analysis.
Q: How is the GE Matrix different from the BCG Matrix?
A: The GE Matrix uses multiple weighted factors, while the BCG Matrix uses only growth rate and relative market share.
Q: Who should use the GE Matrix?
A: Finance professionals, investors, and corporations with multiple business units or product lines.
Conclusion
The McKinsey GE Matrix remains one of the most powerful strategic management tools for portfolio analysis. By systematically evaluating industry attractiveness and business unit strength, finance professionals can:
- Identify growth opportunities
- Reduce portfolio risk
- Improve capital allocation
Mastering this framework equips investors, strategists, and executives with a disciplined approach to making high-stakes portfolio decisions.