The Sharpe Ratio

When evaluating an investment, what's the first thing you typically look at?
For most people, it's the return. E.g., This fund made 15% last year. But what if that 15% came with a rollercoaster ride of volatility? What if you had to endure massive swings, only to end up with a return that could have been achieved with far less stress?
This is the purpose of the Sharpe Ratio.
It goes beyond simple returns to give you a more complete picture of an investment's performance, specifically by considering the risk taken to achieve those returns.
What is the Sharpe Ratio?
The Sharpe Ratio tells you how much excess return you are getting for each unit of risk you're taking.
It helps answer the crucial question - Am I being adequately compensated for the amount of risk I'm exposing myself to?
Imagine two climbers:
- Climber A scales a mountain with a consistent, steady pace, reaching the peak without any major slips or near-falls.
- Climber B reaches the same peak, but their journey involved several terrifying near-misses, scrambling over precarious ledges, and moments where they almost fell.
Both achieved the same result, but Climber A's journey was far less risky. The Sharpe Ratio helps distinguish between these two scenarios in investments.
The Formula
Sharpe Ratio = (Rp−Rf) / σp
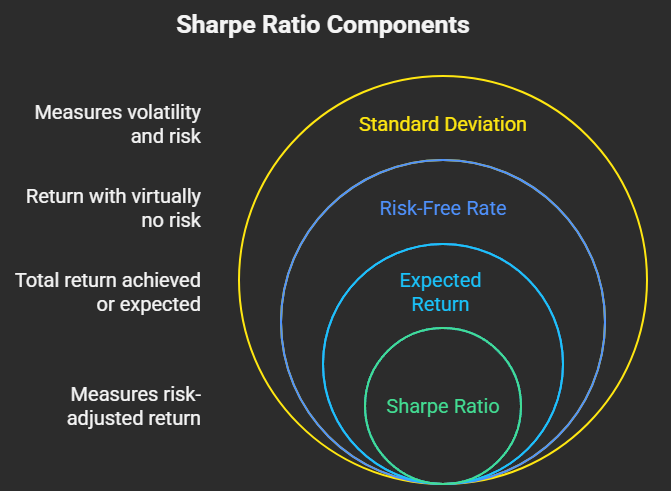
Let's break down each component:
- Rp: This is the expected return of the portfolio or investment. This is the total return you've achieved or expect to achieve.
- Rf: This is the risk-free rate of return. This represents the return you could earn from an investment with virtually no risk, such as a 10Y government bond. We subtract this because we want to measure the excess return that the investment delivers above and beyond what you could get for no risk.
- σp (sigma p): This is the standard deviation of the portfolio's returns. This is our measure of risk. Standard deviation quantifies the historical volatility or dispersion of an investment's returns around its average. A higher standard deviation indicates greater volatility and thus, higher risk.
How to Interpret the Sharpe Ratio
Generally, a higher Sharpe Ratio is better.
- Sharpe Ratio < 1.0: The investment is generating less than one unit of excess return for each unit of risk. This might suggest the risk taken isn't adequately compensated.
- Sharpe Ratio between 1.0 and 1.99: This is generally considered good. The investment is generating a reasonable amount of excess return relative to its risk.
- Sharpe Ratio >= 2.0: This is often considered very good or excellent. The investment is generating a significant amount of excess return for the risk involved.
- Sharpe Ratio >= 3.0: This is rare and often considered exceptional.
The Sharpe Ratio is best used for comparing investments against each other, particularly those within the same asset class or with similar investment objectives. It's less useful for absolute judgment unless you have a benchmark in mind.
Why is the Sharpe Ratio Important?
- Risk-Adjusted Performance: It forces you to look beyond just the top-line return and consider the journey your money took. A lower return with less risk might actually be superior to a higher return achieved with extreme volatility.
- Comparative Tool: It allows you to objectively compare two different investment opportunities. Fund A returned 10% with a Sharpe Ratio of 1.5, while Fund B returned 12% with a Sharpe Ratio of 0.8. Which is better? Fund A, because it delivered more bang for its buck in terms of risk.
- Portfolio Construction: Financial professionals use the Sharpe Ratio extensively to optimize portfolios, aiming to maximize risk-adjusted returns.
- Identifying True Skill: A consistently high Sharpe Ratio over time can be an indicator of a skillful fund manager who can generate returns without taking undue risks.
Example
Let's say we're comparing two hypothetical portfolios over the past year:
- Portfolio A:
- Annual Return (Rp): 15% (0.15)
- Standard Deviation (σp): 10% (0.10)
- Portfolio B:
- Annual Return (Rp): 20% (0.20)
- Standard Deviation (σp): 25% (0.25)
Assume the Risk-Free Rate (Rf) is 3% (0.03).
Calculation for Portfolio A: Sharpe Ratio A = (0.15−0.03) / 0.10 = 1.2
Calculation for Portfolio B: Sharpe Ratio B = (0.20−0.03) / 0.25 = 0.68
Interpretation: Even though Portfolio B had a higher absolute return (20% vs. 15%), Portfolio A delivered a significantly better risk-adjusted return (1.2 vs. 0.68). This means Portfolio A generated more excess return for each unit of risk taken, making it the more efficient investment based on the Sharpe Ratio.
Sharpe Ratio vs. Other Risk-Adjusted Metrics
While the Sharpe Ratio is a cornerstone of investment analysis, it's part of a broader family of metrics designed to evaluate performance relative to risk. Understanding a few key alternatives can provide a more nuanced perspective:
- Sortino Ratio: This is arguably the most common alternative. The crucial difference is how it defines risk. While the Sharpe Ratio uses total volatility (standard deviation, accounting for both upside and downside swings), the Sortino Ratio focuses only on downside deviation. This means it only penalizes volatility that results in returns below a certain minimum acceptable return (often the risk-free rate or zero). For investors who are primarily concerned with avoiding losses, the Sortino Ratio can be a more intuitive measure.
Sortino Ratio = (Rp−T) / Dd
Where:
- Rp = Expected return of the portfolio
- T = Target or minimum acceptable rate of return (often the risk-free rate)
- Dd = Downside deviation of the portfolio's returns (only measures the standard deviation of returns that fall below the target return)
- Treynor Ratio: Similar to the Sharpe Ratio, but instead of using total risk (standard deviation) in the denominator, it uses beta. Beta measures an investment's systematic risk – its sensitivity to overall market movements. The Treynor Ratio is best used for diversified portfolios, as it only accounts for market-related risk, assuming idiosyncratic (company-specific) risk has been diversified away.
Treynor Ratio = (Rp−Rf) / βp
Where:
- Rp = Expected return of the portfolio
- Rf = Risk-free rate of return
- βp = Beta of the portfolio
When to Use the Sharpe Ratio
The Sharpe Ratio is a powerful tool, but like any metric, it's most effective when used appropriately.
Best Use Cases:
- Comparing Similar Investments: It excels at comparing funds or portfolios within the same asset class (e.g., two large-cap equity funds, or two high-yield bond funds).
- Evaluating Fund Managers: It can help assess how well a fund manager is generating returns for the level of risk they are taking, compared to peers or benchmarks.
- Portfolio Optimization: It's a fundamental input for portfolio managers aiming to construct portfolios that offer the best risk-adjusted returns.
When to Be Cautious:
- Non-Normal Distributions: If an investment's returns don't follow a normal (bell-curve) distribution – for example, if they have fat tails (more extreme positive or negative events than a normal distribution would predict) – the standard deviation may not fully capture the true risk, and the Sharpe Ratio can be misleading. This is often the case with certain alternative investments like hedge funds.
- Short Time Horizons: Calculating the Sharpe Ratio over very short periods (e.g., a few months) can be highly volatile and not truly reflective of long-term risk-adjusted performance. Longer historical periods generally provide a more reliable ratio.
- Positive Skewness: Paradoxically, an investment that has many small losses but a few very large gains (positive skew) might have a lower Sharpe Ratio because the large positive outliers increase the standard deviation, even though investors would generally welcome such gains. This is where the Sortino Ratio might be more insightful.
- Leverage: An investment using significant leverage might boost its returns (and potentially its Sharpe Ratio), but it also dramatically increases its underlying risk in ways that standard deviation alone might not fully convey.