The Investor's Guide to Top US Economic News Events: Annual Calendar

As an investor, staying ahead of market-moving US economic news events can be the difference between proactive decision-making and reactive losses. Interest rate decisions, inflation data, and employment reports regularly trigger sharp moves across stocks, bonds, currencies, and commodities.
This guide breaks down the most important US economic calendar events, explains why they matter, and shows how investors can position portfolios around them.
Why US Economic News Matters for Investors
Economic data shapes expectations around:
- Monetary policy (interest rates and liquidity)
- Corporate earnings and profit margins
- Consumer behavior and spending trends
- Market volatility and risk sentiment
Markets don’t just react to the data itself - they react to surprises versus expectations. That’s why understanding what to watch is just as important as knowing when it’s released.
Federal Reserve Events (Highest Market Impact)
Federal Open Market Committee (FOMC) Meetings
Frequency: 8 times per year
Market Impact: Extremely High
FOMC meetings determine:
- The federal funds rate
- Forward guidance on inflation and growth
- The overall direction of monetary policy
Key components investors watch:
- Interest rate decision
- Policy statement wording
- Fed Chair press conference
- Dot plot projections (quarterly)
- Summary of Economic Projections (quarterly)
Investor takeaway:
Even small changes in language about inflation or employment can move equity indices, Treasury yields, and the US dollar within minutes.
Jackson Hole Economic Symposium
Timing: Late August
Market Impact: Very High
This annual event often previews major policy shifts before they appear in official decisions.
Why it matters:
- Less formal environment → more candid policy signaling
- Historically linked to major Fed pivots
- Heavily scrutinized by global markets
Inflation Indicators (Policy Drivers)
Consumer Price Index (CPI)
Frequency: Monthly
Market Impact: Very High
Measures price changes consumers experience directly.
Key metrics:
- Headline CPI (YoY)
- Core CPI (excludes food & energy)
- Month-over-month trends
- Services vs. goods inflation
Investor insight:
Hot CPI prints typically pressure equities and bonds while boosting rate-sensitive assets.
Producer Price Index (PPI)
Frequency: Monthly
Market Impact: High
Tracks inflation at the wholesale level.
Why investors care:
PPI often acts as a leading indicator for CPI, especially for goods-heavy sectors.
Personal Consumption Expenditures (PCE) Price Index
Frequency: Monthly
Market Impact: Very High
The Fed’s preferred inflation gauge.
Focus point:
Core PCE trends matter more for long-term policy direction than short-term CPI volatility.
Employment Data (Economic Momentum)
Nonfarm Payrolls (NFP)
Timing: First Friday of each month
Market Impact: Very High
Includes:
- Job creation/losses
- Unemployment rate
- Labor force participation
- Wage growth
- Revisions to prior months
Trading impact:
Often causes sharp intraday swings in equities, bonds, and currencies.
Weekly Initial Jobless Claims
Frequency: Weekly
Market Impact: Moderate to High
Provides near-real-time insight into labor market stress.
Investor use:
Early warning signs of economic slowdowns or labor market deterioration.
Economic Growth Indicators
Gross Domestic Product (GDP)
Frequency: Quarterly
Market Impact: High
Tracks total economic output.
Most important reading:
The advance estimate, markets price it in fastest.
ISM Manufacturing & Services PMI
Frequency: Monthly
Market Impact: High
- Above 50 = expansion
- Below 50 = contraction
Why PMIs matter:
They are leading indicators, often signaling turning points before GDP data confirms them.
Consumer Spending & Confidence
Retail Sales
Frequency: Monthly
Market Impact: High
Since consumers drive ~70% of US economic activity, this data strongly influences growth expectations.
Watch closely:
- Core retail sales
- Control group data
- Seasonal adjustments
Consumer Confidence Index
Frequency: Monthly
Market Impact: Moderate to High
Divergences between current conditions and future expectations often signal upcoming economic shifts.
Housing Market Indicators
Housing Starts & Building Permits
Frequency: Monthly
Market Impact: Moderate
Highly sensitive to interest rates and financing conditions.
Existing Home Sales
Frequency: Monthly
Market Impact: Moderate
Provides insight into:
- Inventory levels
- Price trends
- Consumer balance sheet health
Annual US Economic Events Calendar
Q1
- January: Fed Chair testimony to Congress
- February: Semiannual Monetary Policy Report
- March: FOMC meeting with projections
Q2
- April–June: GDP releases and revisions
- May: FOMC meeting
- June: FOMC meeting + projections
Q3
- July: FOMC meeting
- August: Jackson Hole Symposium
- September: FOMC meeting + projections
Q4
- October: Initial Q3 GDP reading
- November: FOMC meeting
- December: Final FOMC meeting + projections
Key Data Sources & Tools
Primary Sources
- Federal Reserve Economic Data (FRED)
- Bureau of Labor Statistics
- Bureau of Economic Analysis
- Conference Board
Investor Dashboard Metrics
- Fed funds rate expectations
- 2-year & 10-year Treasury yields
- US Dollar Index (DXY)
- Volatility Index (VIX)
Turning Economic News into an Edge
Successfully navigating US economic news requires preparation, context, and discipline. Markets don’t reward raw data, they reward understanding how that data changes expectations.
By tracking these key economic events, comparing results against forecasts, and managing risk thoughtfully, investors can turn volatility into opportunity rather than uncertainty.
How Everything Links Together: The Economic Chain Reaction Investors Must Understand
For investors, individual economic data points rarely matter in isolation. Markets move based on how these indicators interact, reinforce each other, and ultimately influence monetary policy, earnings, and risk appetite.
Understanding this chain reaction helps investors anticipate moves before headlines hit.
Step 1: Inflation and Employment Drive Federal Reserve Policy
At the center of everything is the Federal Reserve’s dual mandate:
- Price stability (inflation)
- Maximum employment
That means:
- CPI, PCE, and PPI shape inflation expectations
- Nonfarm Payrolls, wage growth, and jobless claims define labor market strength
When inflation is rising and employment is strong, markets price in:
- Higher interest rates
- Tighter financial conditions
When inflation cools or the labor market weakens:
- Rate cuts or pauses come into focus
Investor takeaway:
Most market volatility starts with how new data changes Fed expectations, not the data itself.
Step 2: Fed Expectations Move Rates, Bonds, and the Dollar First
Before stocks react, markets usually reprice:
- Treasury yields (especially the 2-year)
- US dollar strength (DXY)
- Interest rate futures
This is why:
- Hot inflation → yields up, dollar up
- Weak data → yields down, dollar down
Investor takeaway:
Bond markets often call the equity move ahead of time.
Step 3: Interest Rates Influence Equities, Housing, and Credit
Interest rates act as gravity across markets:
- Higher rates
- Pressure growth stocks
- Slow housing activity
- Increase borrowing costs
- Compress valuation multiples
- Lower rates
- Support equities and risk assets
- Boost housing and refinancing
- Improve credit conditions
Housing data, retail sales, and PMIs then reflect these changes with a lag.
Investor takeaway:
Sectors respond differently depending on where rates are headed, not where they are today.
Step 4: Growth Data Confirms or Contradicts the Trend
Indicators like:
- GDP
- ISM Manufacturing & Services PMI
- Retail sales
Help investors answer one key question:
- Is the economy accelerating, slowing, or breaking?
This determines whether markets are in:
- Expansion
- Slowdown
- Recession risk
- Recovery
Investor takeaway:
PMIs often signal turning points before GDP confirms them.
Step 5: Markets Price the Future, Not the Present
By the time economic data looks good or bad in headlines:
- Markets may already be positioned for the next phase
That’s why:
- Stocks can rise during weak data (rate cuts expected)
- Stocks can fall on strong data (policy tightening feared)
Investor takeaway:
Always ask: Does this data change expectations?
If not, the market reaction may fade quickly.
The Big Picture for Investors
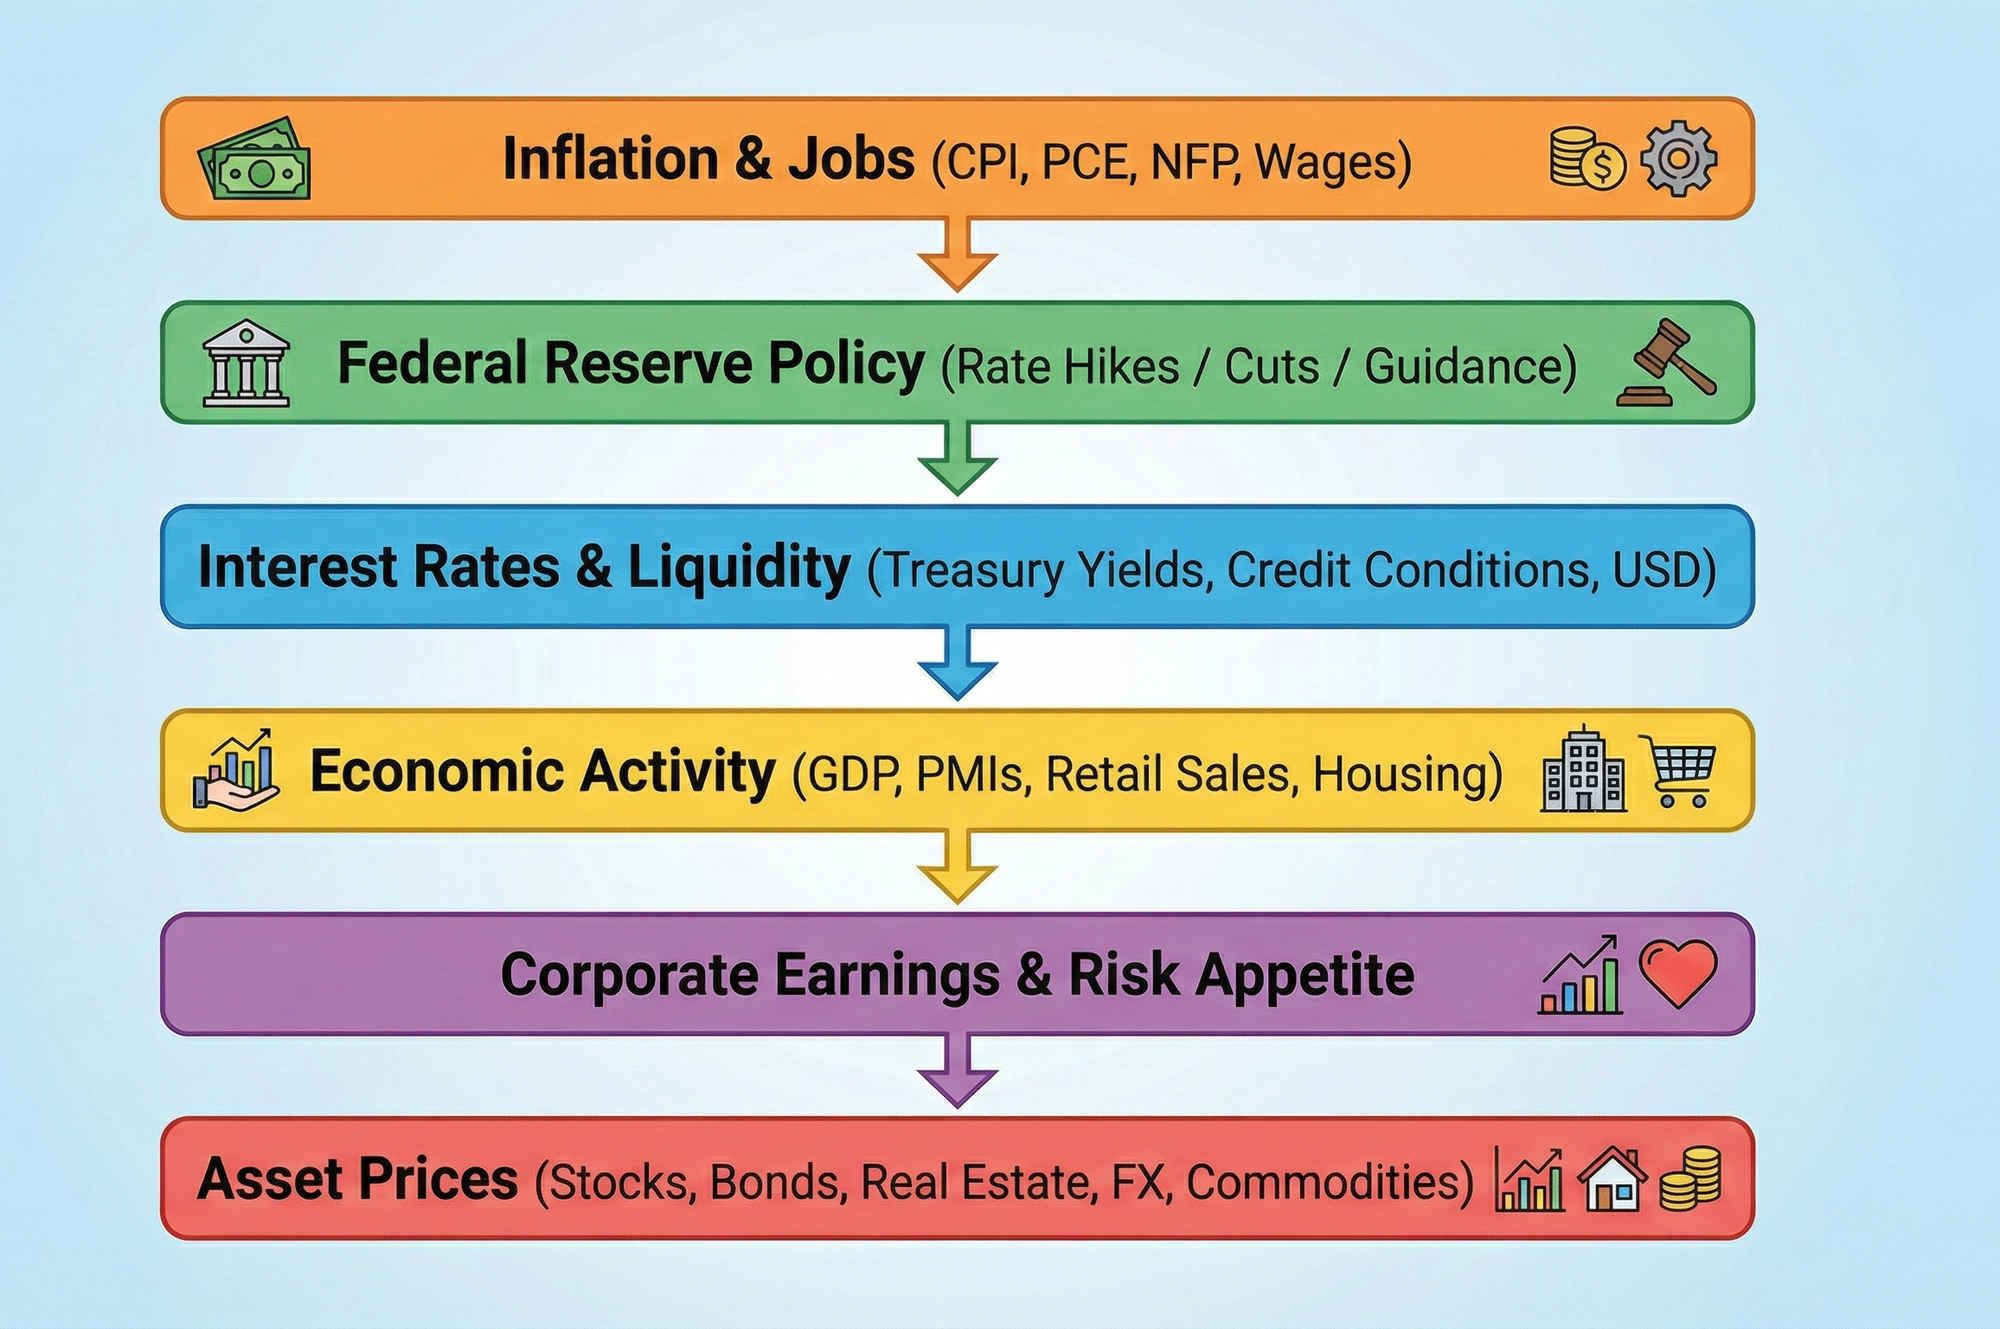
Think of the US economic system as a feedback loop:
Inflation & Jobs → Fed Policy → Rates & Liquidity → Growth & Earnings → Asset Prices
Successful investors don’t just track releases—they:
- Understand cause and effect
- Compare data against expectations
- Position portfolios based on where the cycle is heading
This integrated view is what turns economic noise into a strategic investment edge.